5 Step Guide for Trading & Mastering Charts


Dear Traders,
are you looking for a short guide that summarizes all of the key aspects for chart analysis in one spot?
Our Fibonacci and Elliott Wave guide has proven to be a very popular resource for traders…
So we wanted to offer the same concept but for chart terminology and patterns. This guide tries to explain the most important concepts as quickly as possible.
Our goal is to offer a real practical tool with as little text as possible. This allows traders to quickly use this chart and pattern guide for their technical analysis goals.
P.S. If you want help with manual and automated Forex & CFD trading or passive options trading, check out our live weekly webinars or our other educational guides.
A. The Fabric of Charts
Let’s first start with understanding the DNA of a chart.
- The most basic measurement of a chart is the candlestick.
- This means that candlesticks are the smallest pieces on the price chart.
- All other indicators and patterns are based on candles.
P.S. Other charts include bar charts, line charts, renko bars, range bars, heiken ashi, and many more, but our focus is on Japanese candlesticks..
Here we explain the chart sequence. The sequence starts with the smallest unit and the last point is the largest unit:
- Candlestick
- Candlestick patterns
- Price swings
- Price patterns
- Trend or range
1. Candlestick = the basic unit on the chart
Candlesticks show the balance of power between bulls and bears.
It also reveals who is winning in that candle or battle.
The below image shows a chart (only candlesticks visible). Each unit is one candlestick.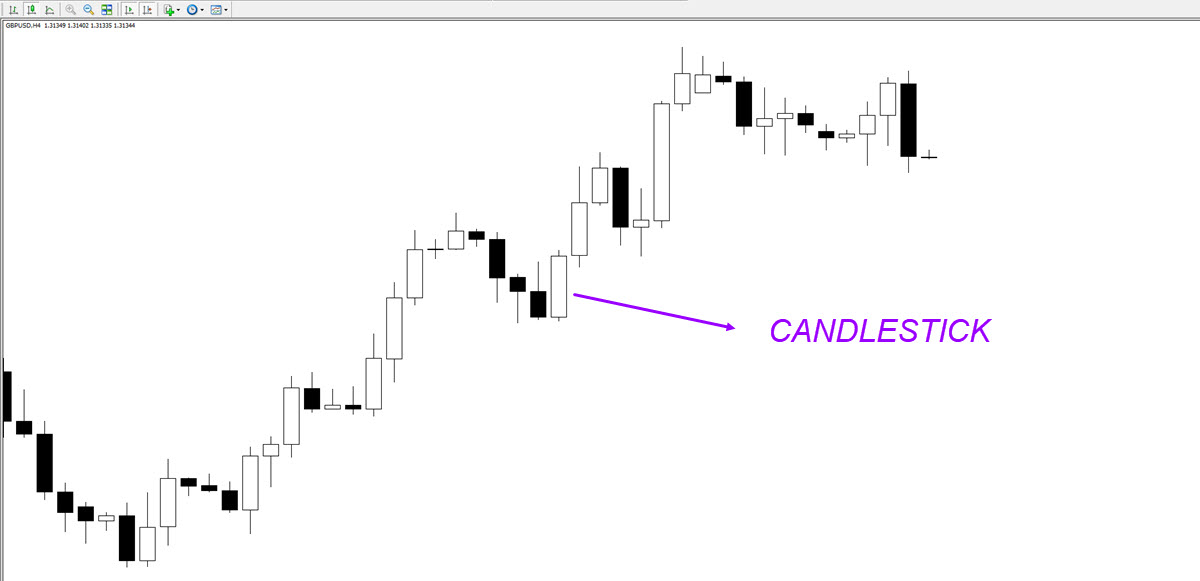
The Japanese candlesticks has 4 parts:
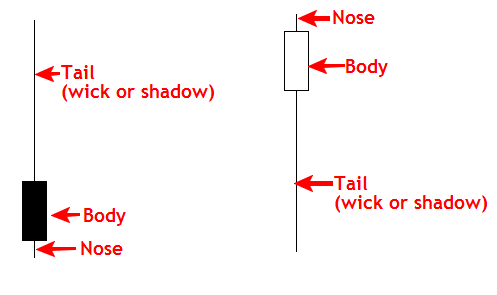
A candlestick can be either bullish or bearish:
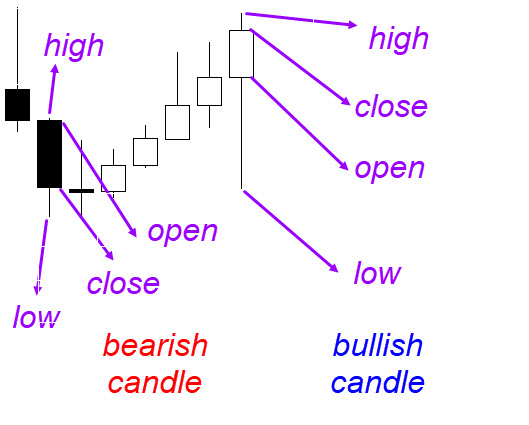
Or a Doji, which means that the candle open and close are within 10% of each other (when compared to entire candle from high to low):
![]()
Check out our master guide on Japanese candlesticks for more information.
2. Candlestick patterns = group of 1-4 candles
Candlestick patterns is a group of 1-4 candles.
They form specific patterns. This provides information about the direction of the chart.
In general, there are 4 types of patterns:
- Bearish reversal candlestick patterns
-
- Price is in a uptrend but could reverse down
- Bearish continuation candlestick patterns
-
- Price is in a downtrend and could continue down
- Bullish reversal candlestick patterns
-
- Price is in a downtrend but could reverse up
- Bullish continuation candlestick patterns
-
- Price is in a uptrend and could continue up
For an overview of all candlestick patterns, view our free guide on price action from A to Z.
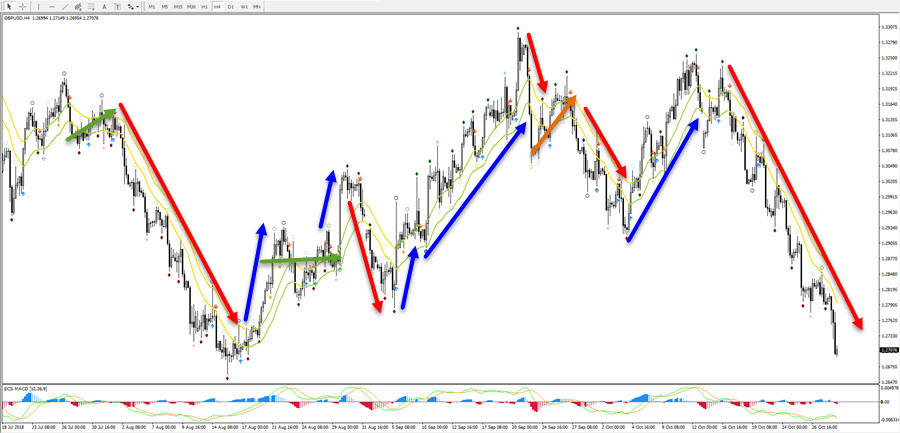
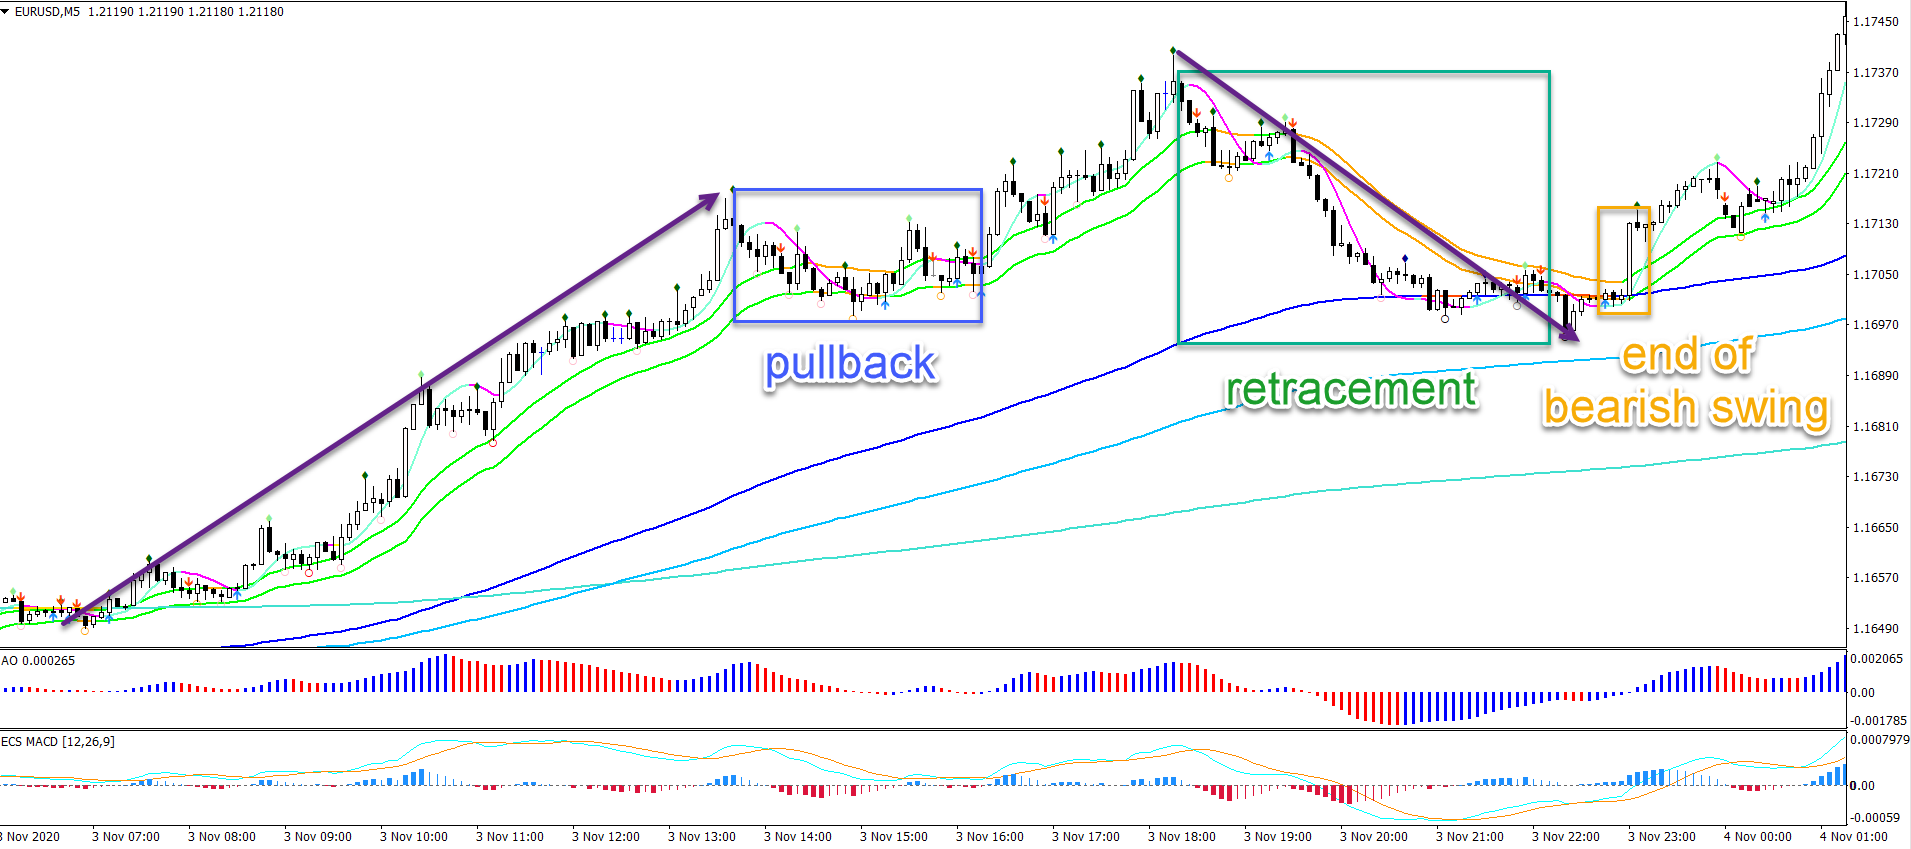
3. Price swings = group of candles
Price swings is a group of candles… Usually more than 5 candles.
A price swing is when a series of candles form one larger unit or “leg”. They indicate a larger price movement.
Price swings form one leg when they share the same characteristics:
- Common direction
- Strength
Here is what we mean:
- Common direction: price has (mostly) the same direction (sideways, up, down)
- Strength: price has (mostly) the same speed:
- Quick= impulsive
- Slow = corrective
Price swings often start and end via candlestick patterns. Although it is not a must.
Price swings (start and end) can be measured in multiple ways.
- There is not just one right answer.
- A wide range of tools can help traders identify price swings.
- The most important is that traders get used to a tool and build up experience with that.
Here are some tools used for spotting the start and end of price swings:
- Momentum and correction concept
- HMA moving average
- Awesome Oscillator (AO) and ecs.MACD
- ECS fractal indicators
- Time patterns and zigzag indicator
We will explain the above 5 aspects later in the guide.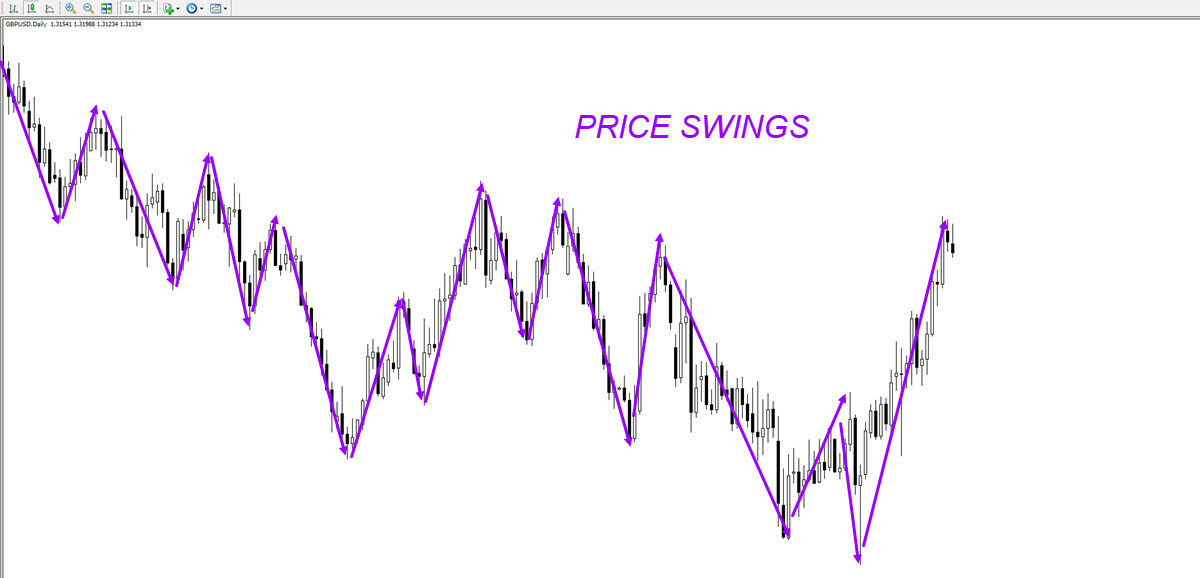
This creates four different types of price movements.
This can be seen as the “DNA” or “heart beat” of the market:
| Direction / Speed | Impulsive | Corrective |
| Bullish | Bullish impulse | Bullish correction |
| Bearish | Bearish impulse | Bearish correction |
Price swings are the building block for identifying and seeing chart plus wave patterns.
Wave patterns are price swings which have an additional wave label attached to them based on the Elliott Wave Theory.
Read more information about our guide on price swings or learn how to master waves with our SWAT course (Simple Wave Analysis and Trading).
4. Price pattern = a group of price swings
A price pattern = a group of price swings that connect to form a pattern.
The pattern indicates bullish or bearish direction and continuation or reversal:
- Bullish continuation chart patterns.
- Bearish continuation chart patterns.
- Bullish reversal chart patterns.
- Bearish reversal chart patterns.
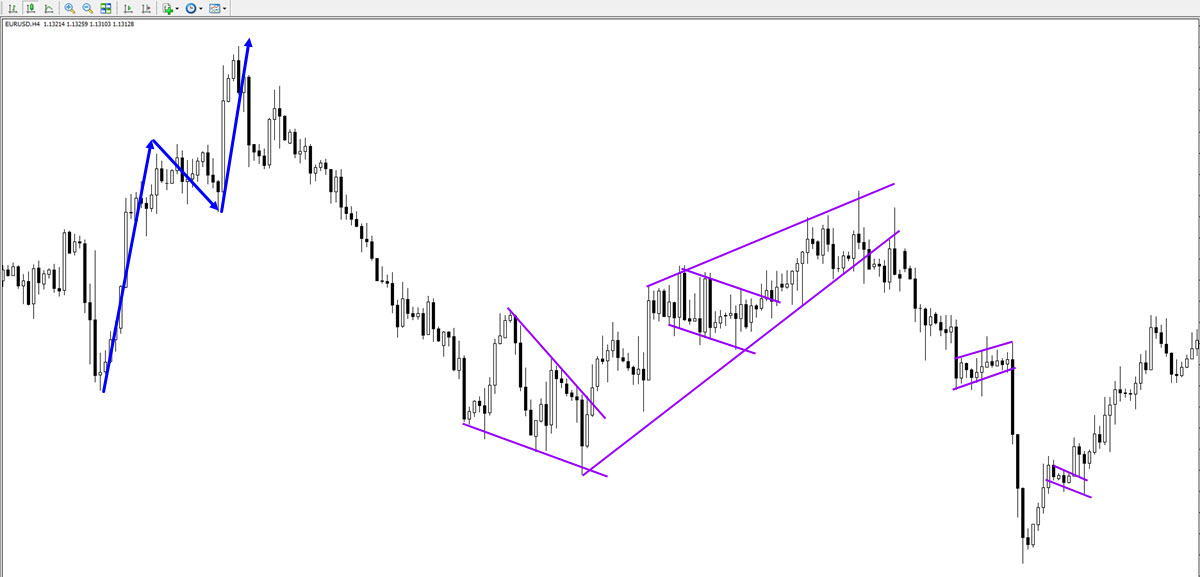
Chart Patterns
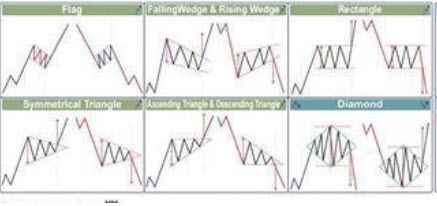
Bullish and Bearish Continuation Patterns
Continuation patterns indicate the continuation of either an uptrend or downtrend:
- Continuation patterns are characterized by an one directional impulsive price movement (momentum), followed by a corrective chart pattern of some type.
- Usually, price breaks into the same direction as the momentum (confirmation) whereas a break into the opposite direction indicates pattern failure.
The main continuation patterns are summarised here:
-
- Flag pattern:
- Bull flag = bullish
- Break of resistance = confirmation
- Break of support = pattern failure
- Bear flag = bearish
- Break of resistance = pattern failure
- Bear of support = confirmation
- Bull flag = bullish
- Flag pattern:
- Contracting triangle pattern:
-
- Bullish momentum followed by triangle = bullish break expected
- Break above resistance = confirmation
- Break below support = invalidation
- Bearish momentum followed by triangle = bearish break expected
- Break above resistance = invalidation
- Break below support = confirmation
- Bullish momentum followed by triangle = bullish break expected
-
- Sideways zone:
-
- Bullish momentum followed by sideways zone = bullish break expected
- Break above resistance = confirmation
- Break below support = invalidation
- Bearish momentum followed by sideways zone = bearish break expected
- Break above resistance = invalidation
- Break below support = confirmation
- Bullish momentum followed by sideways zone = bullish break expected
-
- Ascending and descending wedge:
- Bullish momentum followed by wedge = bullish break expected
- Break above resistance = confirmation
- Break below support = invalidation
- Bearish momentum followed by wedge = bearish break expected
- Break above resistance = invalidation
- Break below support = confirmation
- Bullish momentum followed by wedge = bullish break expected
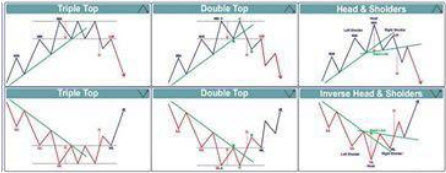
Bullish and Bearish Reversal Patterns
Reversal patterns are patterns that go against the trend.
The main reversal patterns are summarised here:
- Double top or double bottom:
-
- Double top = bearish
- Break of resistance = pattern failure
- Break of support = confirmation
- Double bottom = bullish
- Break of resistance = confirmation
- Bear of support = pattern failure
- Double top = bearish
-
- Triple top or triple bottom:
-
- Triple top = bearish
- Break of resistance = pattern failure
- Break of support = confirmation
- Triple bottom = bullish
- Break of resistance = confirmation
- Bear of support = pattern failure
- Triple top = bearish
-
- Head and shoulders (H&S), inverted H&S:
-
- H&S = bearish
- Break of resistance = pattern failure
- Break of support = confirmation
- Inverted H&S = bullish
- Break of resistance = confirmation
- Bear of support = pattern failure
- H&S = bearish
-
- Falling or rising wedge:
- Falling wedge = bearish
- Break of resistance = pattern failure
- Break of support = confirmation
- Rising wedge= bullish
- Break of resistance = confirmation
- Bear of support = pattern failure
- Falling wedge = bearish
Read more about our guide on chart patterns.
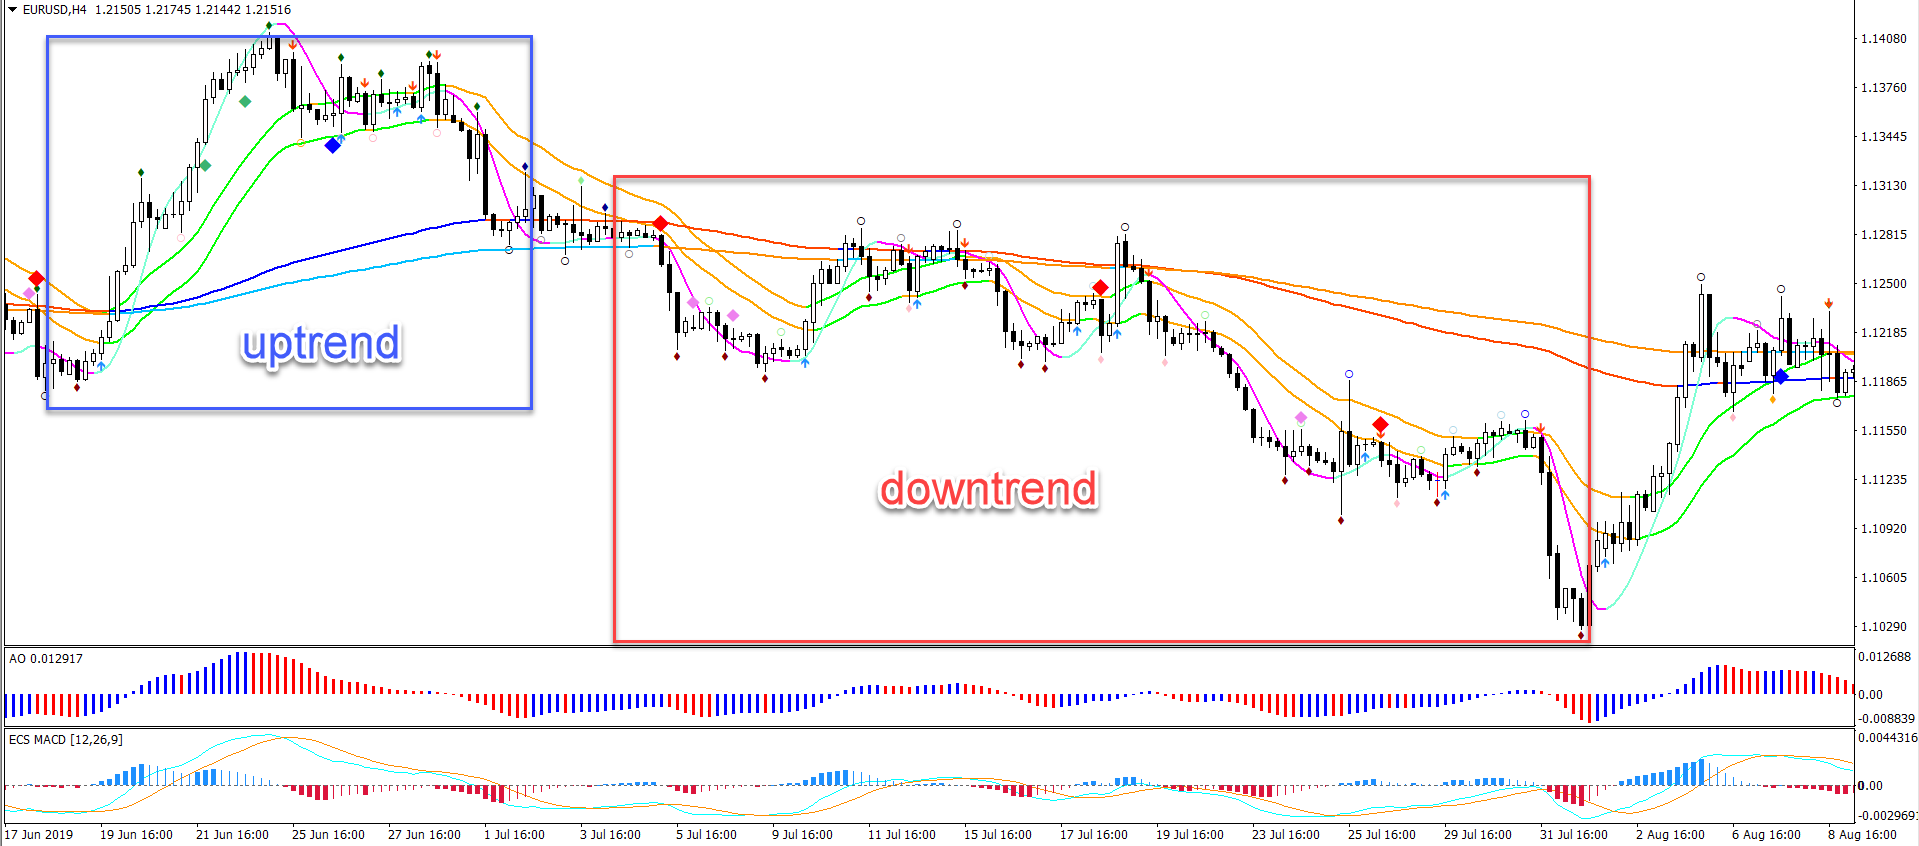
5. Trend, range, reversal = multiple price swings
Trend, reversal or range is based on multiple price swings.
They can be connected to form a larger direction and channel.
The overall angle of the channel could be up, down or sideways.
- A trend channel is either up or down.
- Whereas a range is always going sideways.
- An uptrend has a sequence of higher lows and higher highs.
- A downtrend has a sequence of lower highs and lower lows.
Read more about the trend fits within technical analysis.
Read more about retracement and reversals.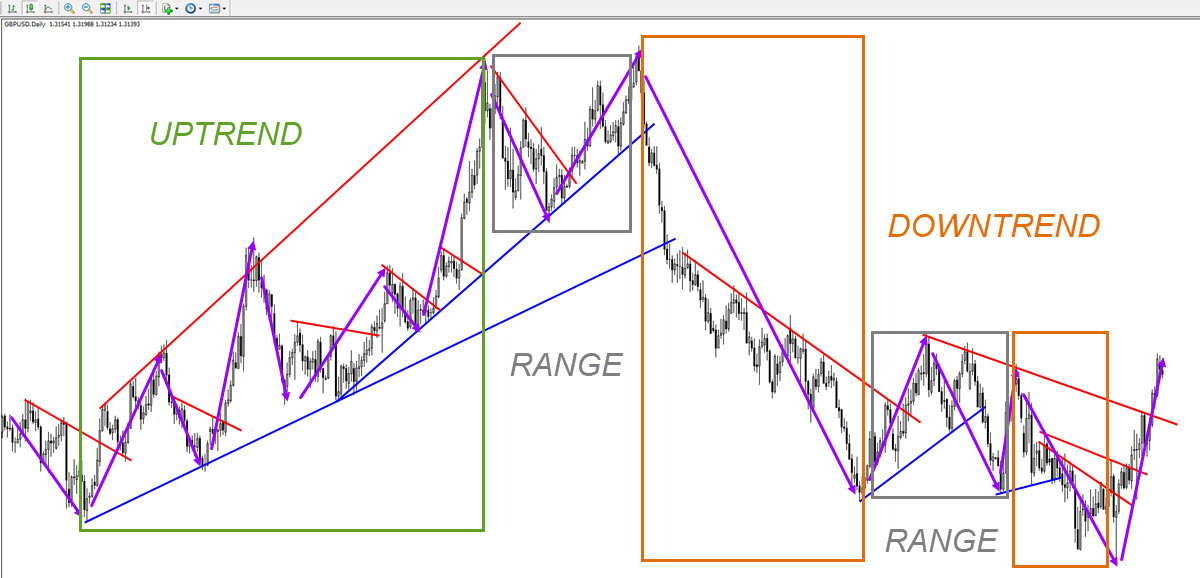
B. Support and Resistance
Support and Resistance (S&R) are price levels / areas / zones that can stop price from continuing into the same direction.
- If the S&R is strong enough, the price will change direction or move sideways at S&R.
- If the S&R is weak, the price will not change direction and break through the S&R.

Support and Resistance (S&R) levels can be indicated by:
- Round levels
- Tops and bottoms
- Pivot points
- Fibonacci levels
- Moving averages
- Trend lines and channels
- Other price action indicators
- And many other tools and indicators
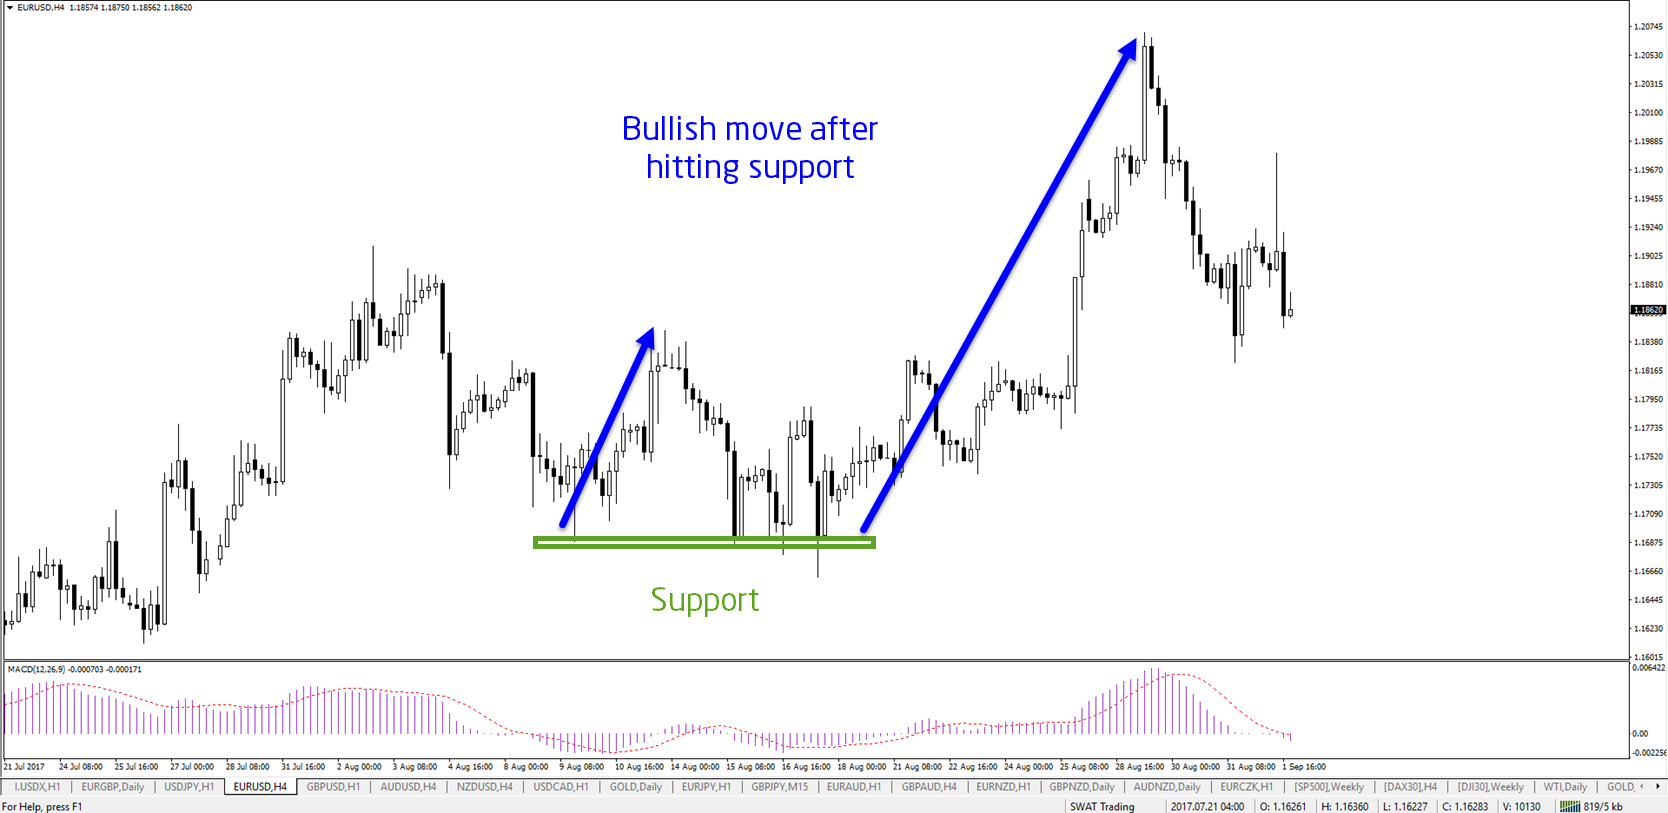
S&R remains valid when price is reversing or “bouncing” at S&R:
- Bullish bounce: price is bouncing up at support.
- Bearish bounce: price is bouncing down at resistance.
S&R becomes invalid when price manages to break through it:
- Bullish breakout: price is breaking above resistance.
- Bearish breakout: price is breaking below support.
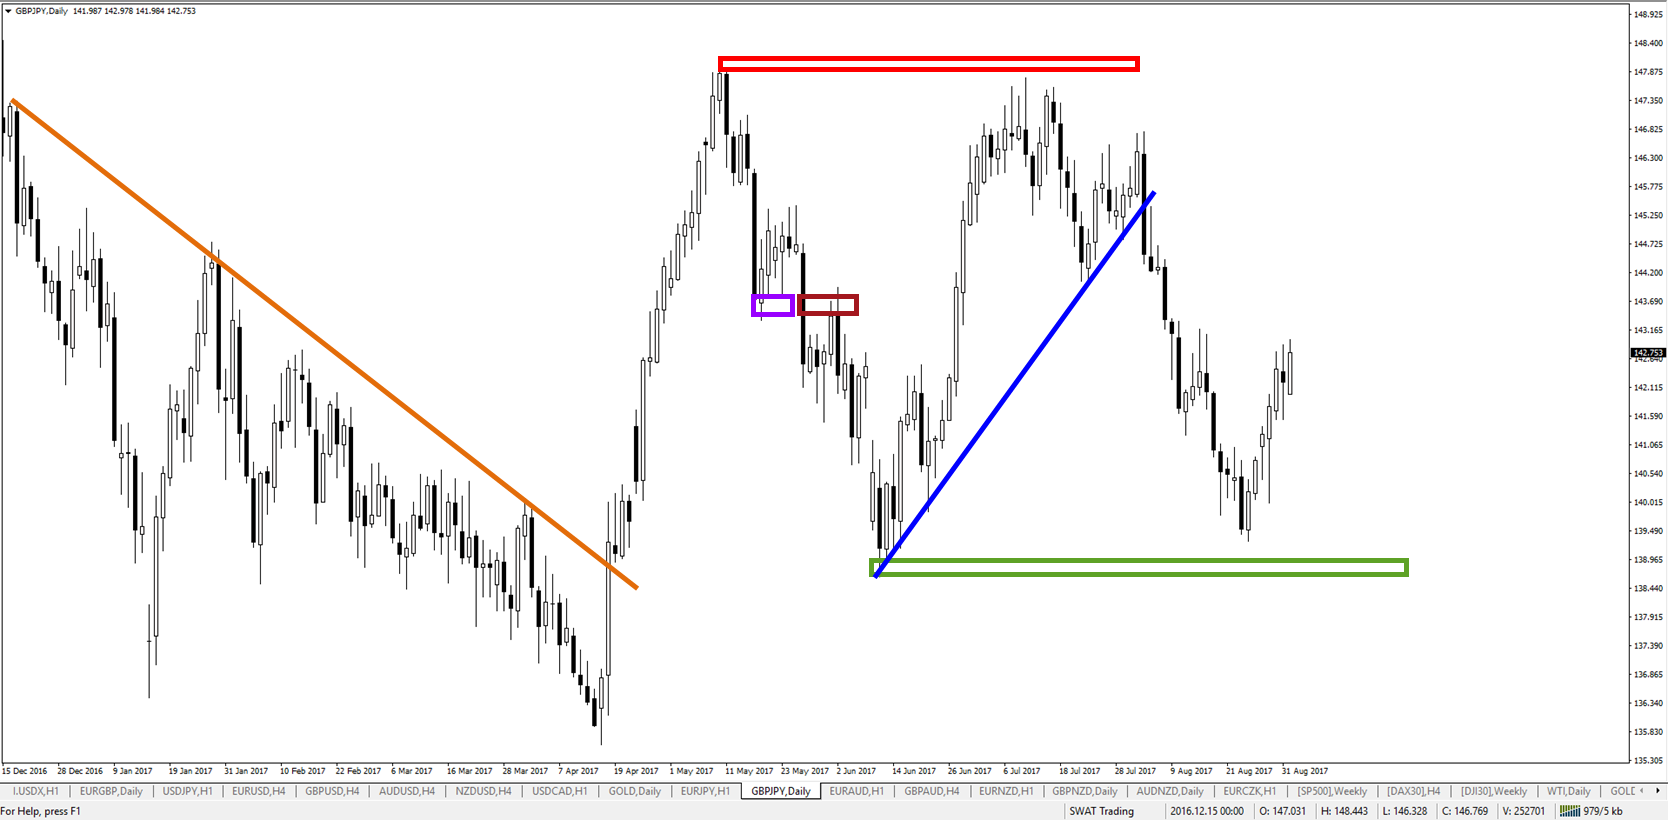
Once S&R is broken, their role can turn around like this:
- Broken support becomes a potential new resistance level.
- Broken resistance becomes a potential new support level.
A point of confluence (POC zone) is when there are multiple support and/or resistance levels located around the same level.
- This makes the S&R more difficult to break.
- A bounce becomes more likely.
- At least when price action approaches it for the first time.
A decision zone is an even more important POC zone, because the break or bounce confirms or invalidates your analysis.
- This is the “moment of truth”.
- It will determine whether you trade the setup or whether you trade ends in a win or loss.
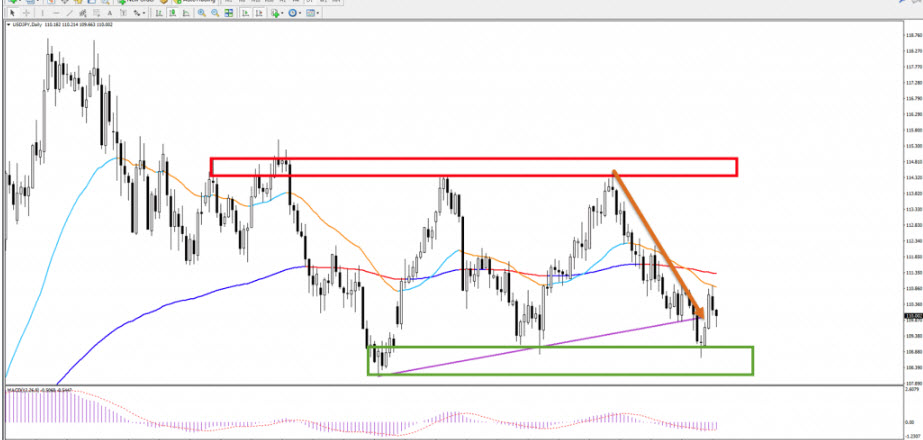
Traders can trade at S&R by:
- Either waiting for a breakout or bounce.
- For instance, if traders see a key resistance zone at 1.20, they could enter a trade with a pending order just above 1.20.
- Trading before the breakout or bounce occurs.
- For instance, if traders see a key support zone at 1.20, they could enter a trade with a pending order just at 1.20.
In our article on S&R called the “Ultimate Forex Guide for Trading Support and Resistance (S&R)”, we discussed several parts:
- What is support and resistance?
- Why are support and resistance levels important?
- What is the benefit of support and resistance when trading?
- How to find support and resistance levels?
- How to find support and resistance levels in day trading?
- What tools and indicators indicate support and resistance?
- How to draw support and resistance?
- What are the best support and resistance levels?
- How can traders trade at support and resistance?
- How precise are support and resistance levels?
- How support and resistance plays a vital role in market structure triangle?
- How can traders measure break or bounce chance?
- What is the target of the bounce or break?
- What are the best time frames for support and resistance?
Read the entire S&R guide here.
C. Key Price Patterns from A to Z
There are multiple price patterns that play a key role in analysing and understanding the price charts in a deeper and simpler way. We already discussed two patterns:
- Candlestick patterns – see part A
- Chart patterns – see part A
Here is an overview of the key patterns:
- Fractal patterns
- Moving average patterns
- Elliott Wave patterns
- Fibonacci patterns
- Fibonacci sequence patterns (ecs.WIZZ)
- Time patterns
- Divergence patterns
- Momentum and correction patterns
- Break/bounce, pullback and continuation patterns
- Trend line patterns
Candlesticks, candlestick patterns, and chart patterns have already been mentioned at the start of this article when discussing the Fabric of Charts.
Now let’s review other key price patterns. Let’s start with Fractal patterns.
1. Fractal Patterns
What is Fractal and where do you find it?
A candle with a Fractal indicates that the candlestick low and/or high is a key price level. Those levels act as a support or resistance.
Fractals are patterns and levels that repeat on all time frames and financial instruments. 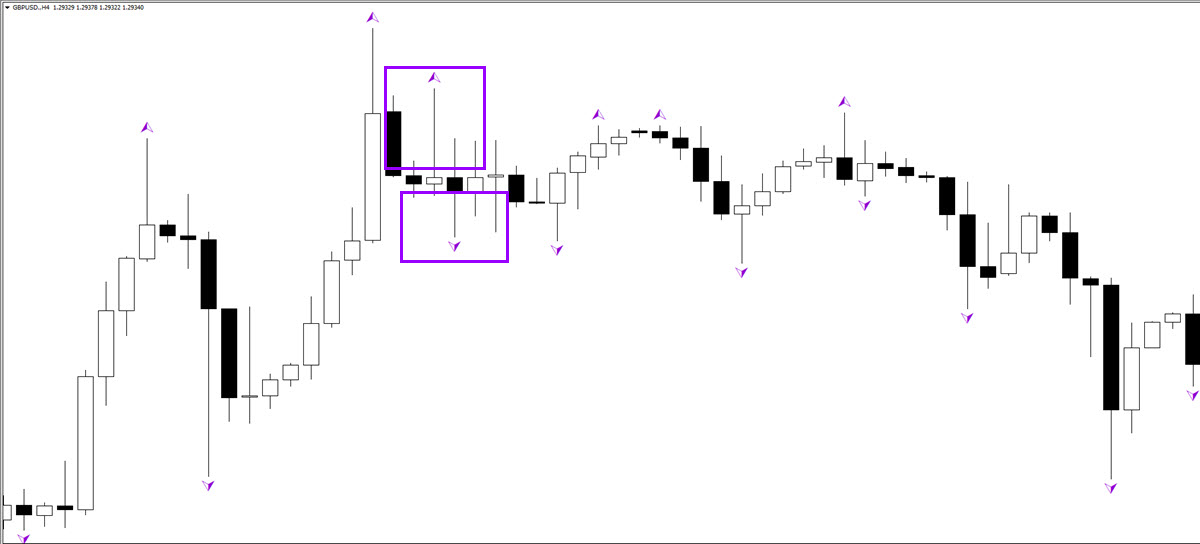
Why are candles in the above image Fractals (roof tops above and below the candle)?
The candle high or low is the highest or lowest of a group of at least 5 candles:
- A Fractal above the candlestick → the candle high is a key resistance level:
- The candle high is the highest high of a group of at least 5 candles.
- The candle high is higher than at least 2 candles directly left and right of it.
- More candle highs to the left and right of it that are lower is OK.
- A Fractal below the candlestick → the candle low is a key support level:
- The candle low is the lowest candle low of a group of at least 5 candles.
- The candle low is lower than at least 2 candles directly left and right of it.
- More candle lows to the left and right of it that are higher is OK.
Fractal indicator is good for spotting breakouts, bounces, and filtering out setups.
Fractals can be used as part of manual and automated trading systems.
- They do need to be part of a set of trading rules.
- It’s best to use them together with other indicators for trading decisions.
- Although the creator Bill Williams did (almost) fully depend on the Fractal indicator on the daily commodity charts, we advise to use them with other rules and indicators.
Fractal indicator vs MAs:
- Candles of support and/or resistance Fractals above 21 emas / 144 ema: very bullish
- Candles of support and/or resistance Fractals at 21 emas: correction / pullback
- Candles of support and/or resistance Fractals at 144 ema: key decision zone
- Candles of support and/or resistance Fractals below 21 emas / 144 ema: very bearish
For deeper information on the Fractal indicator, view our Fractal guide.
2. Moving Averages Patterns
Moving averages (MAs) provide a wealth of information. We use moving averages levels that are based on Fibonacci sequence levels like 21, 89, 144, and 233.
- Key decision zones when price approaches them: price could bounce or break at 21 ema zone (high and low) and 144 ema close.
- Trade bounces at MAs: price bouncing at the 21 or 144 ema zone or the Fractal at the 21 or 144 ema zone.
- Trade breakouts above or below MAs: price breaking the 21 or 144 ema zone or the Fractal at the 21 or 144 ema zone.
- Use them for targets (aiming at MAs): aim at the next big MA.

- Use the levels for placing stop losses: place the stop loss on the opposite side of the 21 ema zone.

- Define the trend with them: 21 ema zone versus the 144 ema close.
- Understand the strength of momentum: HMA 20 angle and position versus 21 ema zone. Also the number of candles not hitting the 21 ema zone (blue boxes).

- Understand a range: 21 ema zone angle is flat and moving around 144 ema close.
For deeper information on the Fractal indicator, view our guide on Moving Averages.
3. Elliott Wave Patterns
Elliott Wave (EW) is a forecasting tool and allows traders to understand the psychology of the price action. This in turns helps explain price patterns and the market structure in more depth.
Wave analysis is based on the concept that price charts and financial markets follow specific patterns called waves, which are based on Elliott Wave (EW) Theory.
These repetitive price movements are the result of a natural rhythm of crowd psychology that exists in all markets. How can traders apply wave analysis?
The Elliott Wave Theory (EWT) is best understood by using price swings and price patterns, which are supported by 1) moving averages and 2) concepts of impulsive (quick price) and corrective (slow price) price swings.
Here is how:
- First, traders can analyse price swings by their direction (bullish / bearish) and character (impulsive (quick) / corrective (slow) ).
- Secondly, traders can label those price swings with numbers (1-5) and letters (A-C) according to the Elliott Wave Theory.
- Thirdly, traders can read the sequence of swings and labels to understand the story of the waves patterns and understand the expected direction, character, and wave label of the current and next price swings.
Traders can simply ride and trade the waves without counting the waves by understanding how price moves in relation to moving averages (MAs), MAs vs MAs, and the Fractal indicator vs MAs.
My SWAT course explains how to use these tools and concepts correctly to analyse and trade wave patterns.
Or check out our full Elliott Wave and Fibonacci guide – you will not be disappointed by it. Thousands of viewers use it each month to help remind them how to use waves.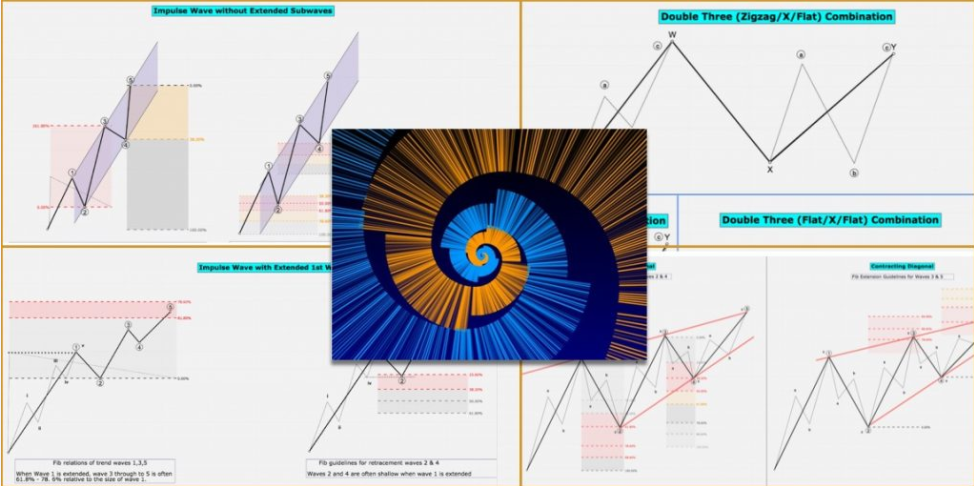
4. Fibonacci Patterns
Fibonacci goes hand in hand with the Elliott Wave (EW) Theory.
Why? Both concepts heavily rely on price swings:
- We place the Fibonacci tool on a completed price swing on any time frame of choice.
- But we also label the Elliott Wave after a price swing is completed.
Price swings is a key concept for both Elliott Wave and Fibonacci:
- If we know how to recognize price swings, then it will be easier to know where to place the Fibonacci tool and how to read waves.
- But keep in mind that understanding price swings is easier when you know more info about the Elliott Wave.
The best tip is to place the tool on the most dominant and strongest price swing from left to right. Place it from top to bottom for a downtrend and from bottom to top for an uptrend.
Then keep an eye on the following Fibonacci levels:
- The 23.6% and 38.2% Fibonacci retracement levels are considered shallow pullbacks and are typical for waves 4.
- The 50% and 61.8% Fibonacci retracement levels are considered normal retracements and typical for a wave B in a zigzag and sometimes wave 2.
- The 78.6% and 88.6% Fibonacci retracement levels are considered deep retracements and are typical for a wave 2 or a wave B in a flat correction. Also, this is a spot where the wave 1 can end in the opposite direction (when reversing).
- The -27.2% Fibonacci target is the closest target and is typical for a wave 5 or wave C.
- The -61.8% Fibonacci target is the next target and is typical for a wave C and sometimes a wave 5. A break above this level could indicate a wave 3.
- The -100% Fibonacci target is usually the very max target for a wave C and wave 5. A break above this level could confirm a wave 3.
- The -161.8%, -200, -261.8%, -423.6% Fibonacci targets are typical for a wave 3.
Check out our full Elliott Wave and Fibonacci guide – you will not be disappointed by it. Thousands of viewers use it each month to help remind them how to use waves.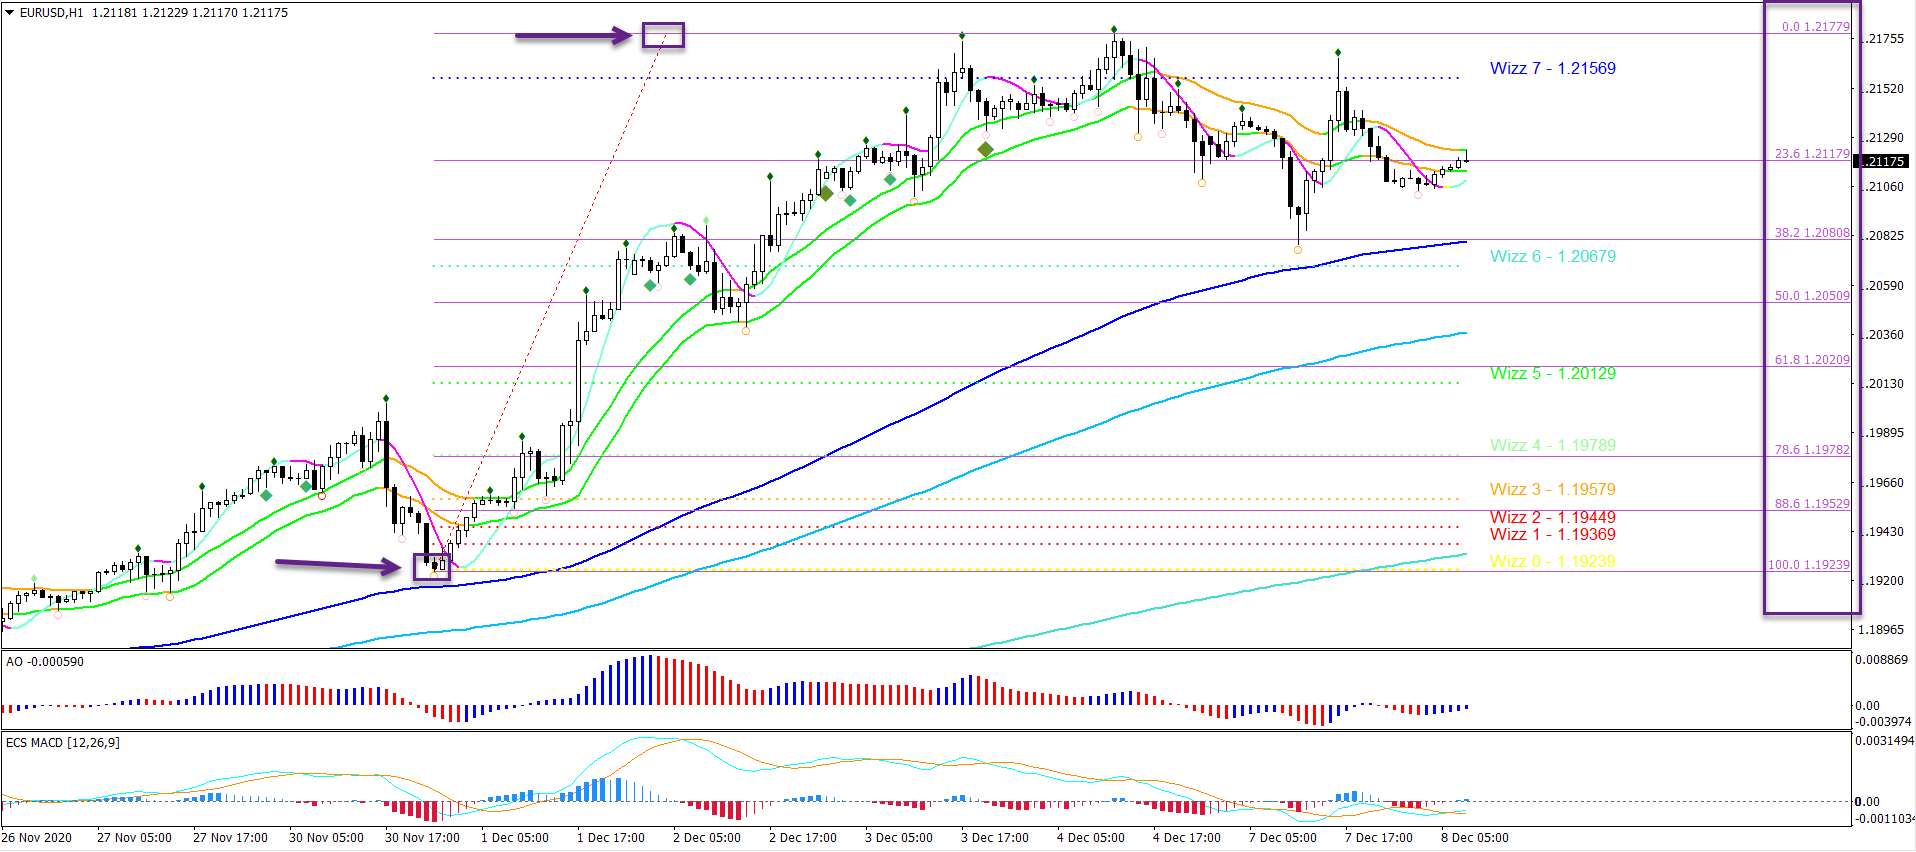
5. Fractal Sequence Patterns (ecs.WIZZ)
We can use Fibonacci also in other ways. Not only via Fib retracement levels and Fib targets, but the actual Fibonacci sequences in pip value.
This is our trick: we count the number of pips from the 144 ema.
Let’s review why:
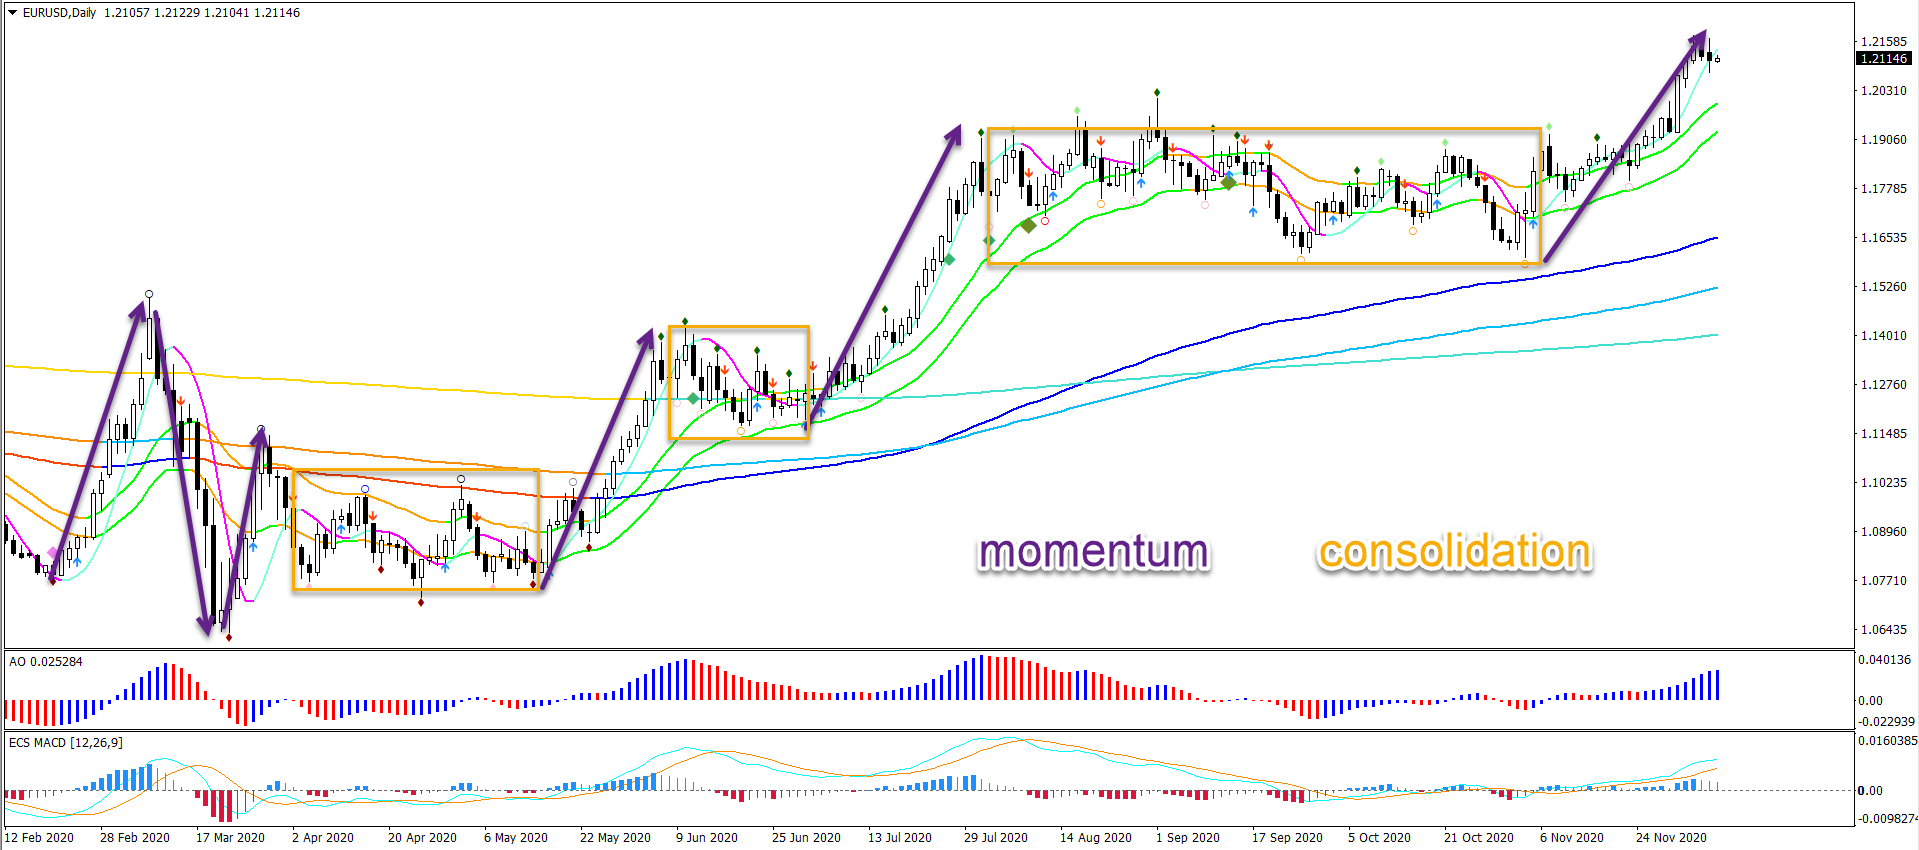
- We noticed that once price action moves away from the 144 ema for a longer distance (measured in pips), this confirms a strong momentum push up or down.
- Once momentum is on its way, price action usually continues in that direction for a while.
- This direction continues until there are clear signs of a reversal like strong S&R levels, divergence patterns, and reversal chart patterns.
- If price action is unable to pull away from the 144 ema, then this usually indicates a lack of momentum and a larger range or pullback.
The ecs.WIZZ indicator helps us with many aspect such as:
- Placing targets.
- Understanding when to expect momentum.
- Knowing when price is a trending space.
- Knowing when the trend is at risk of being over extended.
- Seeing key S&R levels.
This is why we developed an indicator that automatically counts pips from the 144 ema zone, so that we do not need to do anything manually. The indicator also places 10 horizontal levels:
- The first line which marks the starting spot at the 144 ema close.
- This line will change as soon as price hits the 144 ema again.
- The direction of the line depends on price action:
- Price below the 144 ema is bearish
- Price above the 144 ema is bullish
- The next lines are plotted based on the Fibonacci sequence levels:
- Usually the next level starts with 13 pips on 1 or 4 hour charts and lower.
- We start with 55 pips on fast moving pairs on 4 hour charts and 55-144 pips on daily chart or more.
- After that, the next line is plotted with the next sequence level from the 144 ema close:
- Level 0: at 144 ema
- Level 1: 13 pips away from 144 ema
- Level 2: 21 pips away from 144 ema
- Level 3: 34 pips away from 144 ema
- Level 4: 55 pips away from 144 ema
- Level 5: 89 pips away from 144 ema
- Level 6: 144 pips away from 144 ema
- Level 7: 233 pips away from 144 ema
- Level 8: 377 pips away from 144 ema
- Level 9: 610 pips away from 144 ema
- The crucial levels are considered to be these:
- Level 3/4 indicates the main breakout of the range and the start of the trend.
- Levels 3 to 6 indicate the core of the trend
- Levels 6-8 indicate an extension of the trend but price action could be running out of steam
- Levels 8-9 indicate higher chance of overextension so either a range, sideways price action, small with the trend continuation or reversals can appear.
- Break of level 9 can sometimes indicate a massive trend.
See the video for a full overview of ecs.WIZZ.
Get the free ecs.WIZZ tool or the professional version of ecs.WIZZ
6. Time Patterns
The price chart is based on two factors: price and time.
Many traders focus only on price via support and resistance levels. Other traders do use both time and price to understand, for instance, trends and chart patterns.
But we also think that using time patterns is a big plus.
We use time patterns to understand the chance of price action making a reversal, breakout or continuation.
But what are time patterns exactly?
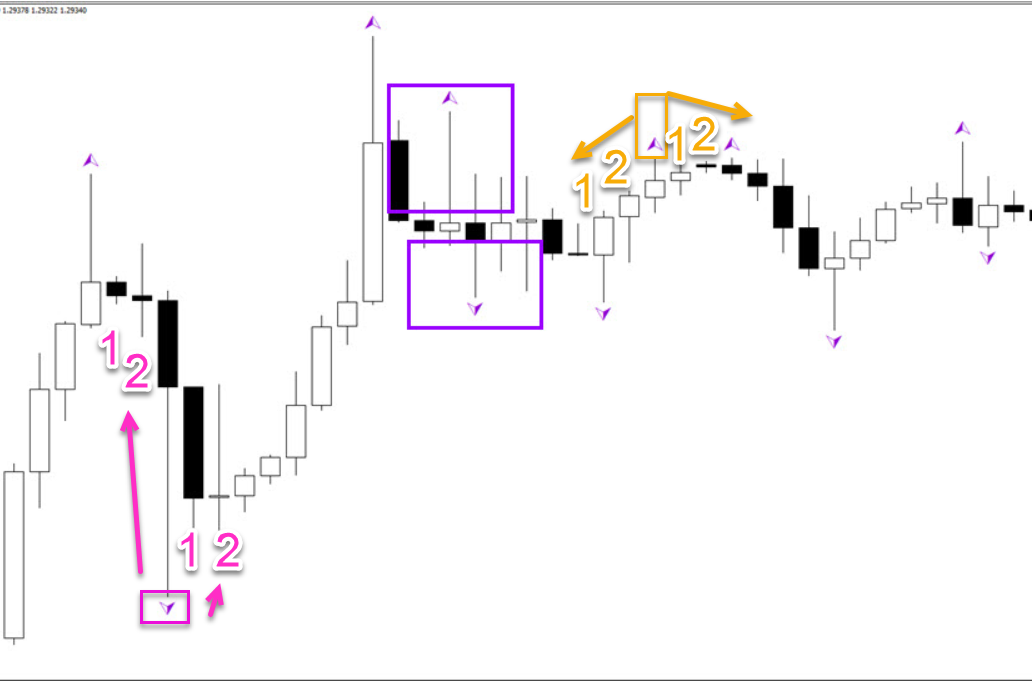
We identify time patterns by counting the number of candles that fail to break a high / top or low / bottom. Here’s why:
- Each candle that breaks the most recent high or low is confirming the continuation of that uptrend or downtrend.
- But once price action fails to break the high or low for a while, then a pullback or reversal is likely to appear.
- Once that pullback has lasted for a while, then a breakout is likely to create a new strong impulse and momentum.
 The key number of candles are 5-7, 13-34, and 55+. The candle count is measured from the most recent highest high or most recent lowest low.
These are again numbers based on Fibonacci sequences. Here is how the Fib sequence levels play a key role:
- Trend: a higher high or lower low within 5-7 candles confirms the continuation of momentum.
- Pullback: once price fails to make a higher high or lower within 5-7 candles, then some type of pullback or retracement is likely.
- If price action shows strength against the previous direction, then a reversal is becoming more likely.
- If price action shows choppiness against the previous direction, then a breakout later on with the trend is more likely.
- If price action breaks between candle 5/7 and 13, then a breakout is more likely to turn into a false breakout (especially for non Yen pairs).
- Correction: once price makes a correction for more then 13 candles, a breakout with the trend is more likely to succeed.
- Break: the breakout remains likely unless:
- Price action breaks the corrective pattern in the opposite direction.
- Price action builds a correction that lasts more then 34 candles.
- The breakout is less reliable between candle 34 and 55 but the trend still has an edge.
- The breakout is very vulnerable to a reversal if the correction takes too long, which is after 55 candles or more.
- In that case, zooming out to one time frame higher helps see the larger picture and avoid false breaks.
- There is also a higher chance of a reversal.
Time patterns should be used together with other tools and indicators to help confirm your analysis.
Read our guide about time patterns.
7. Divergence Patterns
Divergence patterns usually appear when the trend is ending. They indicate that there is an increasing chance of a pullback in the trend or a full reversal against the previous trend.
Divergence patterns mean that price action is confirming a higher high or lower low but the oscillator does not. The failure of the oscillator to confirm the trend indicates that price action is losing its strength. This is a first caution sign.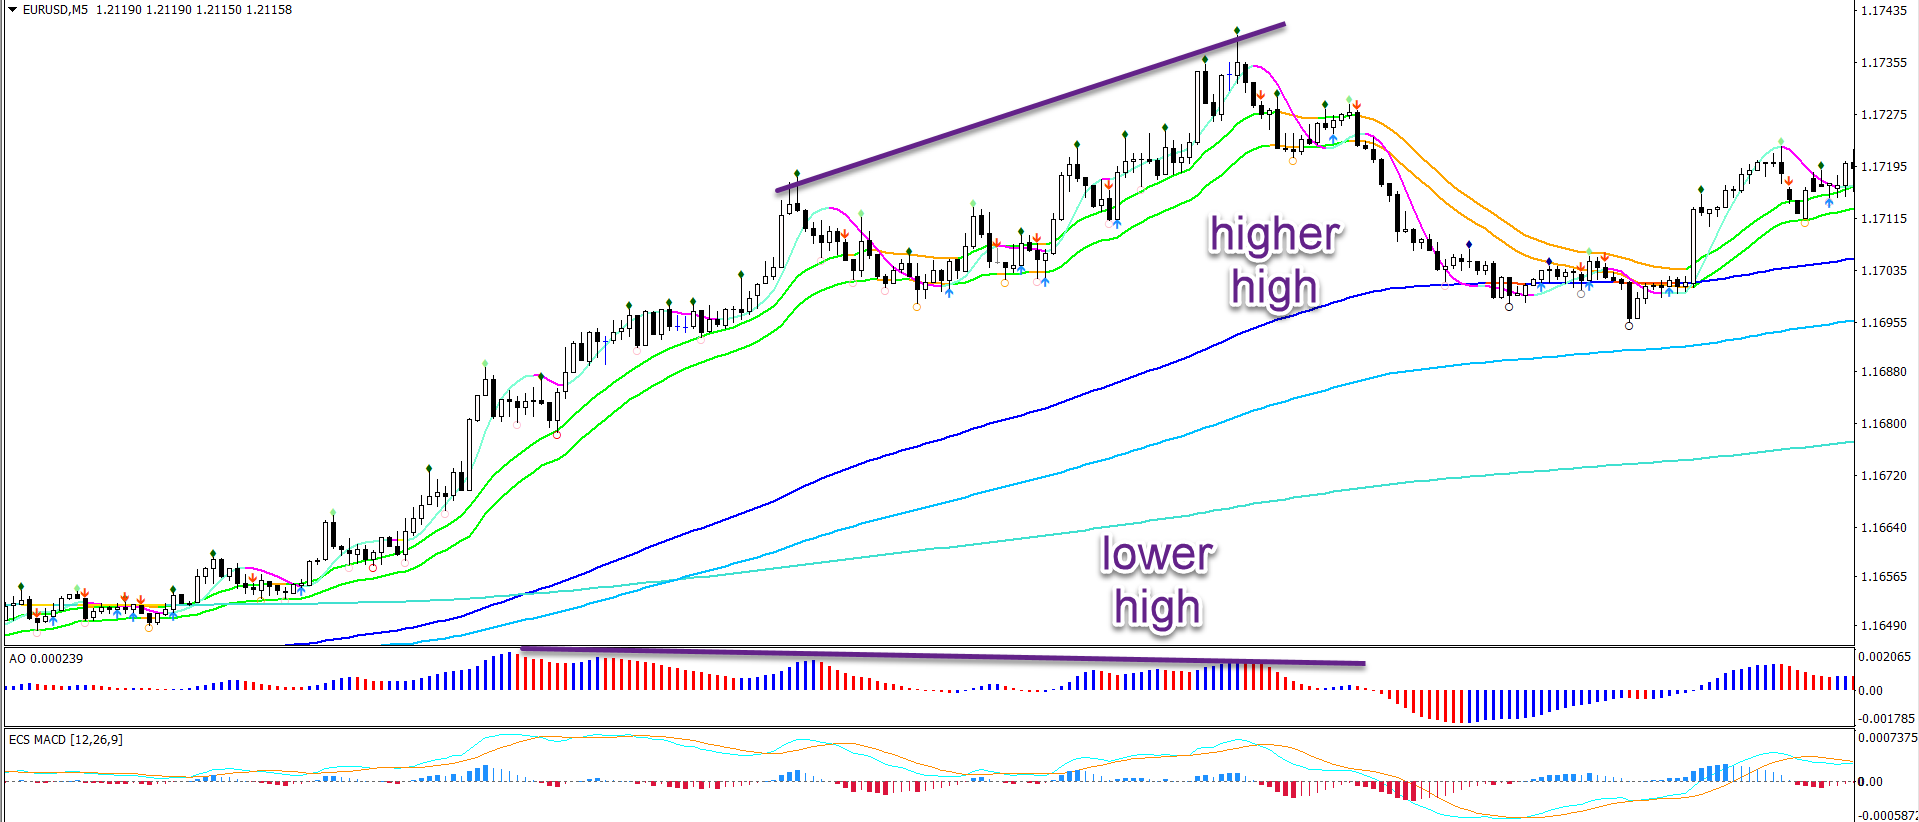
Divergence patterns are warnings and red flags for trend traders to be careful. Either by closing trend trades or reducing risk on and/or entirely skipping future setups with the trend.
But divergence patterns are usually not enough information to trade reversals. That is because divergence patterns are a general warning sign, but often work in advance.
They work as a rough estimate, but do not provide an exact timing. This is why many reversal traders get trapped in early reversal setups before the trend is finished.
Our solution? We only trade against the trend if there are other confirmation signals available, besides divergence patterns.
Other conformations could be:
- Candlestick patterns
- Reversal chart patterns
- Wave patterns
- Break of moving averages
- Break of trend lines
- Proximity of Fibonacci targets and retracement levels
- Proximity of strong support and resistance levels
Here are the divergence patterns explained:
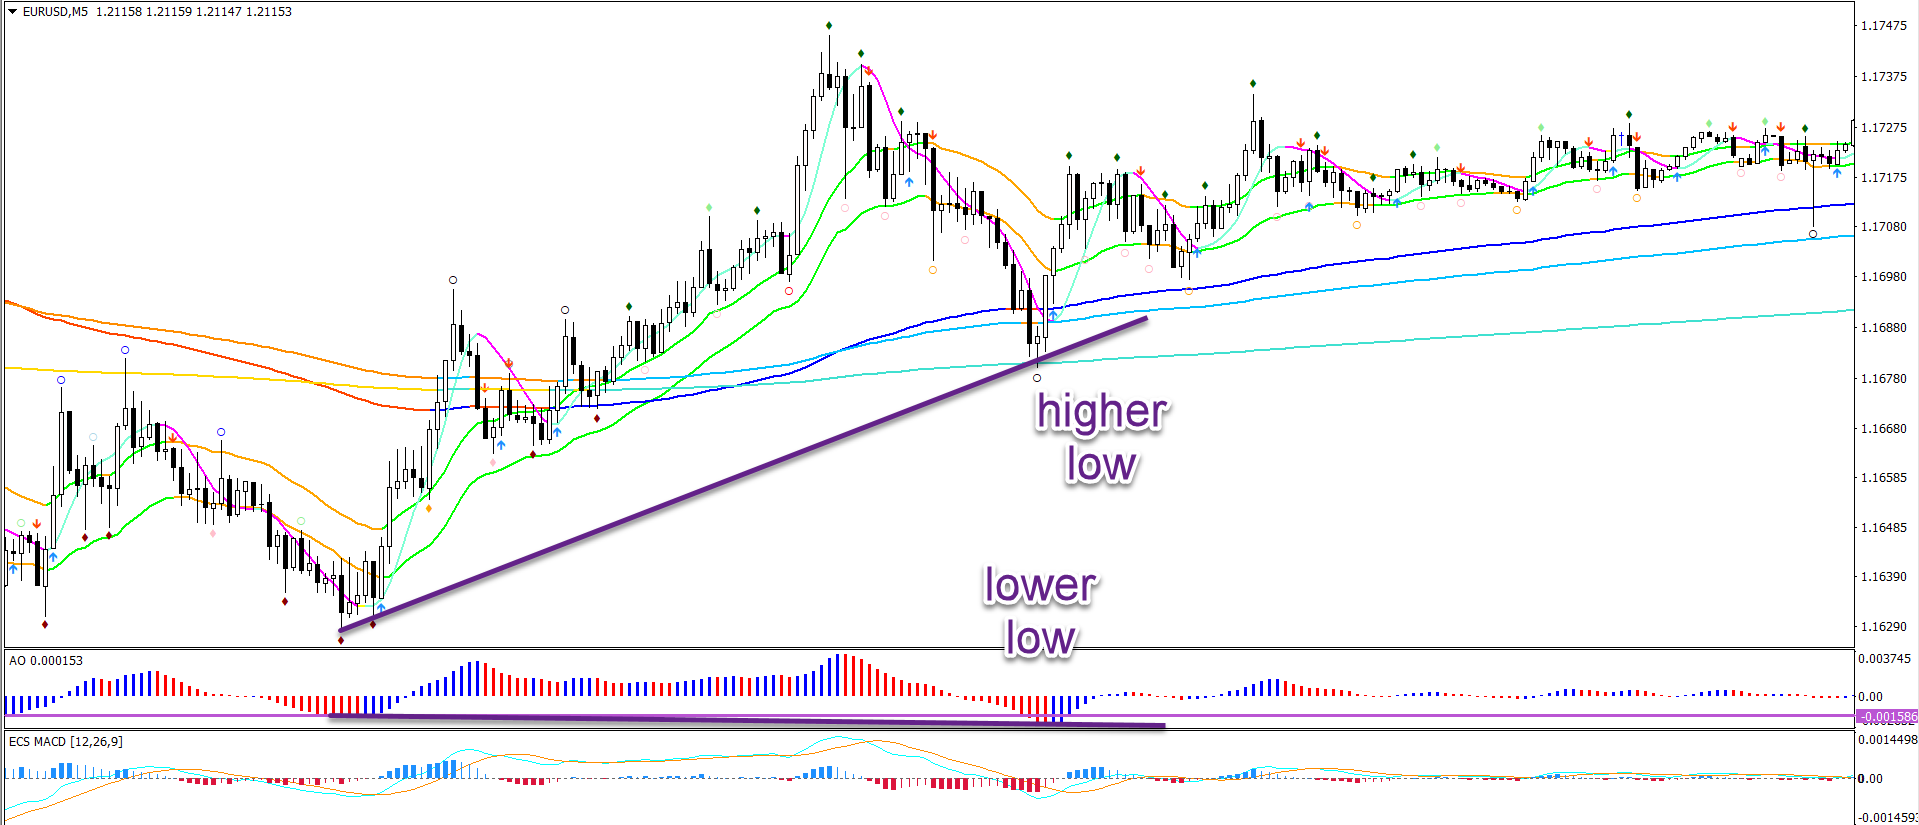
- Bullish divergence:
- Price makes lower low
- Oscillator makes higher low
- Bearish divergence:
- Price makes higher high
- Oscillator makes lower high
- Hidden bullish divergence
- Price makes lower high
- Oscillator makes lower low
- Hidden bearish divergence
- Price makes higher low
- Oscillator makes higher high
Divergence is in itself a strong warning… But the strength of the warning does depend on the time frame as well.
Plus multiple forms of divergence is also stronger than the presence of just one divergence pattern. Let’s examine them one by one:
- 30 min chart or lower:
- Single divergence is considered weak and vulnerable to the trend on higher time frames.
- Multiple divergence is stronger and an OK warning for the trend.
- 60 min chart:
- Single divergence is considered neutral and vulnerable to the trend on higher time frames.
- Multiple divergence is stronger and a good warning for the trend.
- 4 hour chart:
- Single divergence is considered strong.
- Multiple divergence is very strong
- Daily chart or higher:
- Single divergence is considered very strong.
- Multiple divergence is very strong and quite rare.
- Divergences on multiple time frames:
- The more divergence is present on more time frames, the stronger the reversal warning signals become.
When is the divergence pattern considered to be completed? When price action manages to return back to the 144 ema close (or very close to it).
Once price action has made a retracement back to that 144 ema, the divergence pattern on that time frame is not considered to be a valid factor anymore.
That is also the main reason why we use the 144 ema as the official target for any divergence pattern.
Of course, price action can reverse beyond the 144 ema close. This depends on the other time frames and overall structure of the chart.
But divergence usually speaking makes it back to the 144 ema. And if it does not, then that means that the divergence pattern is still a factor to take into account.
Read more about divergence in our guide on divergence.
8. Momentum & Continuation Swings
Momentum and continuation price swings are the heartbeat of the chart. They provide a rhythm to the price movement that allows traders to analyse, estimate, and trade.
There are 4 types of price swings:
- Bullish momentum
- Bullish correction
- Bearish momentum
- Bearish correction
Momentum and continuation price swings are at the heart of the (both continuation and reversal) chart patterns and wave patterns, which allow traders to make better forecasts, analysis, and trading decisions.
- A momentum price swing shows strength in that direction
- A corrective price swing shows weakness and indecision in that direction
- A momentum and correction pattern connects multiple price swings:
- It estimates the development of the current and future price swings.
- It does that based on the history of past swings and the current swing.
Whether price action continues or reverses is not only dependent on the price swing character and direction. Other factors play a role:
- The sequence of the price swings.
- The trend, S&R, and patterns on higher time frames.
- The trend, S&R, and patterns on lower time frames.
9. BPC Patterns (Break/Bounce, Pullback & Continuation)
A well known pattern is called BPC – or Break/bounce, Pullback, and Continuation.
This formation allows traders to wait for a price reaction to confirm their trade idea first… Then, the next step is to find a favourable entry.
There are two types of entries:
- Trigger happy traders: trading the 1st reaction.
- Confirmation traders: waiting for the 2nd of 3rd reaction.
Entering a trade setup as price action is breaking or bouncing is called “trading the first reaction”.
- The advantage is that traders can get a better entry because they are jumping in before any confirmation is visible.
- The disadvantage is that traders can get caught in a false breakout and see price action reverse.
These “trigger happy traders” are also more vulnerable to emotions as the market can move quickly at times.
Jumping in a trade is the opposite of the “confirmation approach”, which allows traders to be more critical with the setups they choose. The BPC concept is a useful filter for avoiding weaker setups.
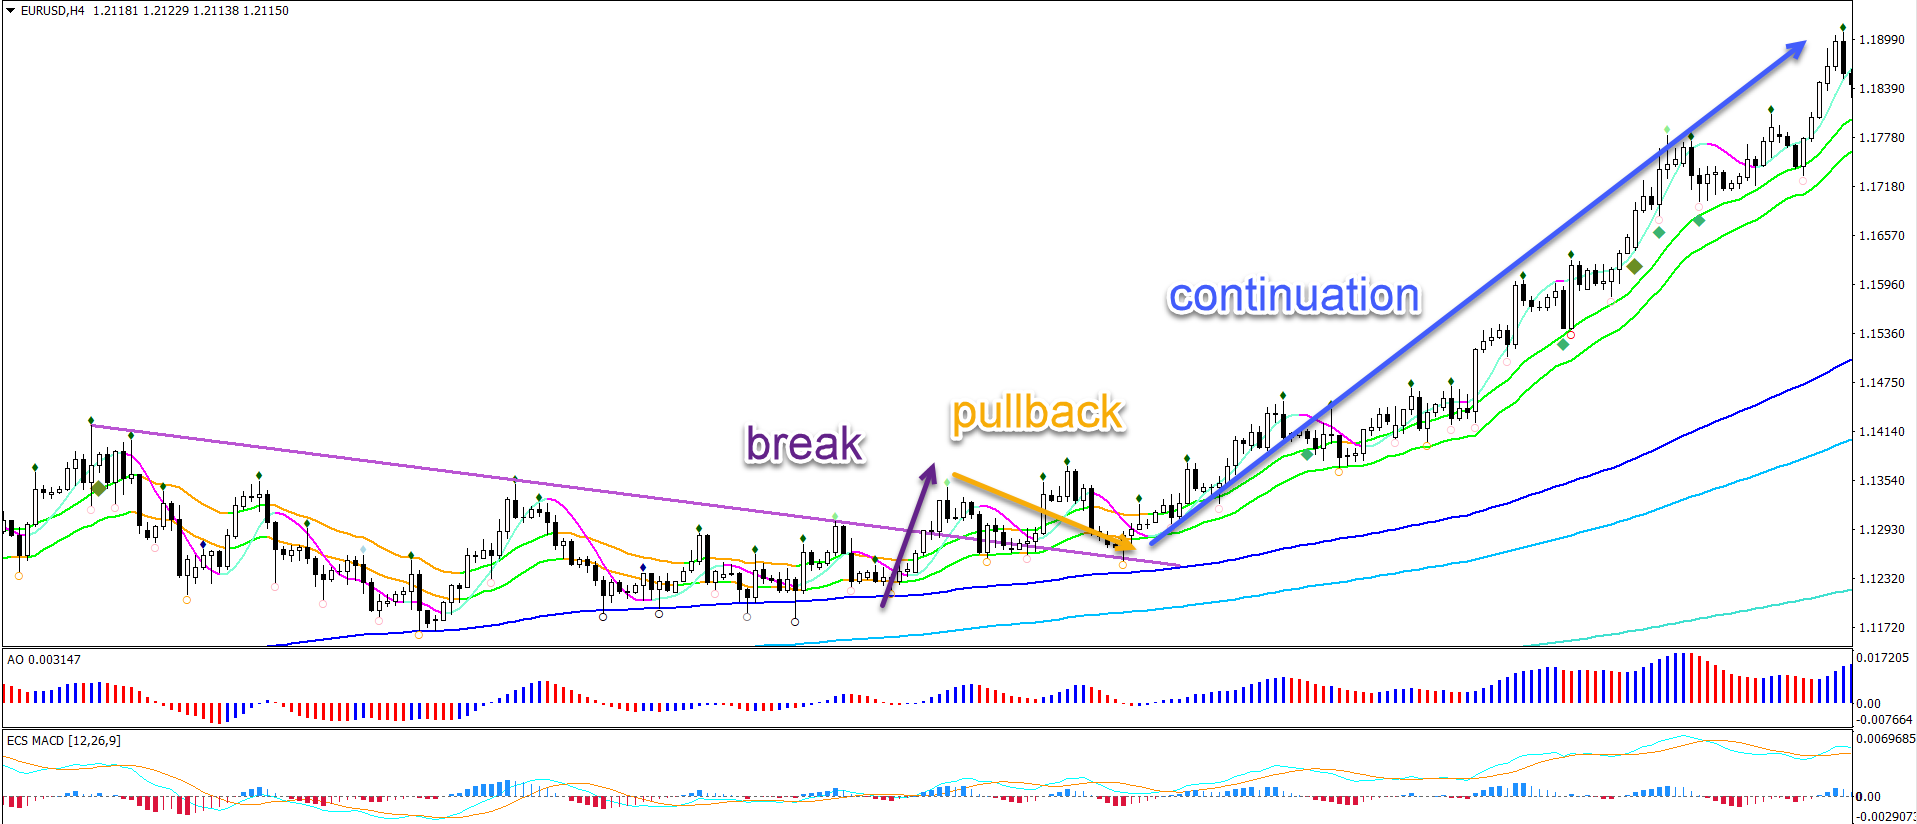
Confirmation traders will determine a key decision zone. But not trade at the decision zone… Instead, traders will wait for a clear price movement first:
- Break or bounce at the decision zone
- Pullback after the break or bounce
- Break: price pullback to broken zone
- Bounce: price respects the support or resistance and traders await a pullback after the bounce to get a better price entry
- Continuation in the direction of the breakout or bounce
The extra dimension is to use multiple time frames and tools for measuring the break, bounce, pullback or continuation:
- A trader can use a trend line for the break or bounce spot.
- A Fibonacci tool for measuring the pullback.
- Then zoom in 1 time frame and use a moving average to confirm the continuation.
The combinations are endless. The BPC concept offers traders a wide spectrum of choice.
10. Trend Line Patterns
Trend lines offer a great concept for understanding the markets. First of all, they are a wonderful tool for using the BPC concept mentioned in point 9.
But they also work well with almost everything else:
- Determining the trend
- Drawing trend channels
- Support and resistance lines
- Spotting chart patterns
It’s pretty simple as well… Just connect 2 or more support and resistance points. You can do that as many times as you want.
Also keep in mind that broken support can be used as resistance and broken resistance can be used as support.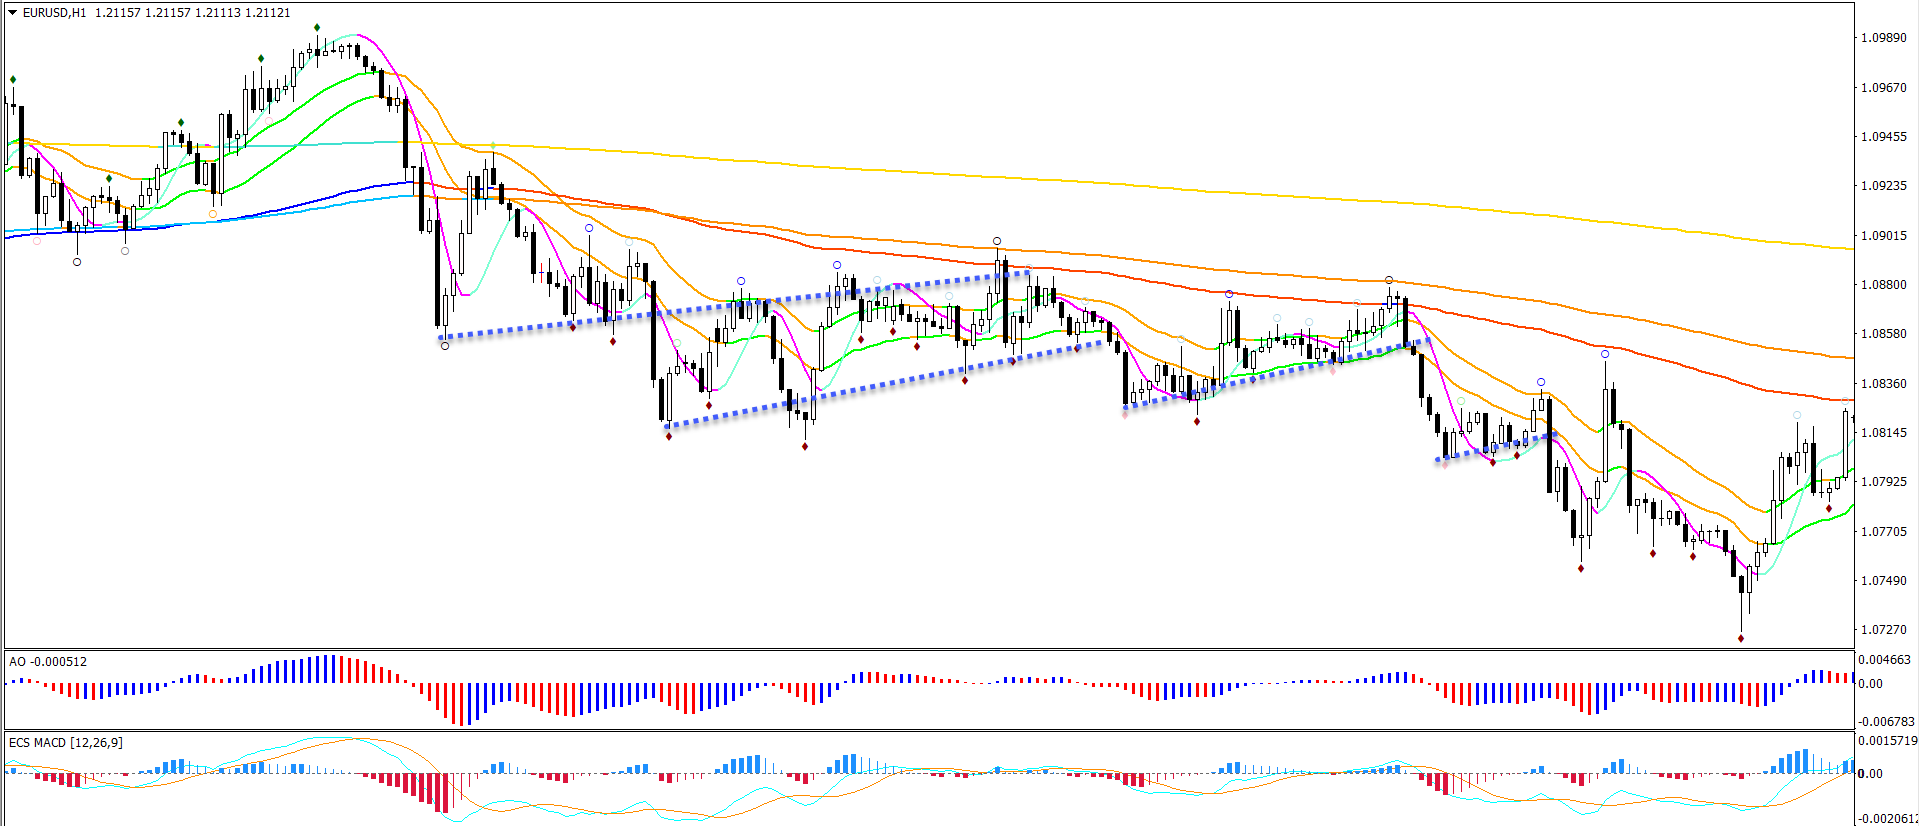
D. Creating a Trading Plan
A trading plan is a set of rules and ideas that provide structure to a trader’s decisions.
This is useful as a tool to combat emotions during trading. It also helps with supporting your trading psychology in general.
The rules can be:
- Very strict (90-100% rules based) or
- Discretionary (part rules, part your own view on current events).
- If the rules are very clear, then this can be translated into an Expert Advisor that trades the financial markets automatically.
A trading plan needs to consider a wide variety of aspects:
- Think about your risk profile, risk appetite, and capital to create a portfolio that matches your vision and comfort zone:
-
- Consider short-term and long-term investments
- Consider how much to set aside for trading that you can afford to risk and in worse case, lose:
- Consider how much to dedicate to manual trading
- Determine the capital per system
- Consider how much to dedicate to automated trading
- Determine the capital per system
- Consider how much to dedicate to manual trading
- Setup a trading psychology and time plan:
-
- How many hours and when do you analyse the markets?
- When do you look for entries?
- How do you manage the trades?
- How do you recognize when emotions are spiraling out of control?
- When do you take breaks during trading?
- How do you manage missed opportunities?
- Determine how to analyse the charts:
-
- How will you determine the trend?
- How will you spot support & resistance?
- How will you determine price patterns?
- Any other tools and indicators?
- Which time frames?
- Which markets?
- Determine how to enter the market:
-
- How do you determine the decision zone?
- Do you use confirmation for entries or enter at the decision zone?
- How do you confirm the entry itself?
- Determine how to exit the market:
-
- Where do you place the stop loss?
- Where do you place the target(s)?
- Do you let the trade run without trade management?
- Or do you actively manage the trade?
- How do you use the trail stop loss?
- Do you move the trade to break even?
- Do you setup targets later?
- Do you move targets closer or further at any point?
- Do you do a market exit?
- Practice, feedback, and evaluation:
-
- Practice is a key process for improving… But it’s not a good idea to experiment during live trading, which is why there are other techniques for training:
- Back-testing
- Paper trading
- Live demo trading
- Trading with an (extra) small live account
- Historical testing
- Small account for fun trading ideas and testing
- Feedback and evaluation
- Keep track of your trading via a trading journal
- Write down notes after a trading day, week or even month with pluses and minuses, things to learn
- Review your learnings points every quarter and keep the ones that need attention and remove the ones that don’t
- Check if you are implementing your trading plan as planned
- Check your trading stats and understand if your strategy is on the right track
- Practice is a key process for improving… But it’s not a good idea to experiment during live trading, which is why there are other techniques for training:
E. Deeper Market Ideas
The market price moves up and down in waves and patterns.
Interestingly, the price movements are similar regardless of the time frame.
A trader who is looking at a large time scale will see the same price movements and patterns on a lower time frame.
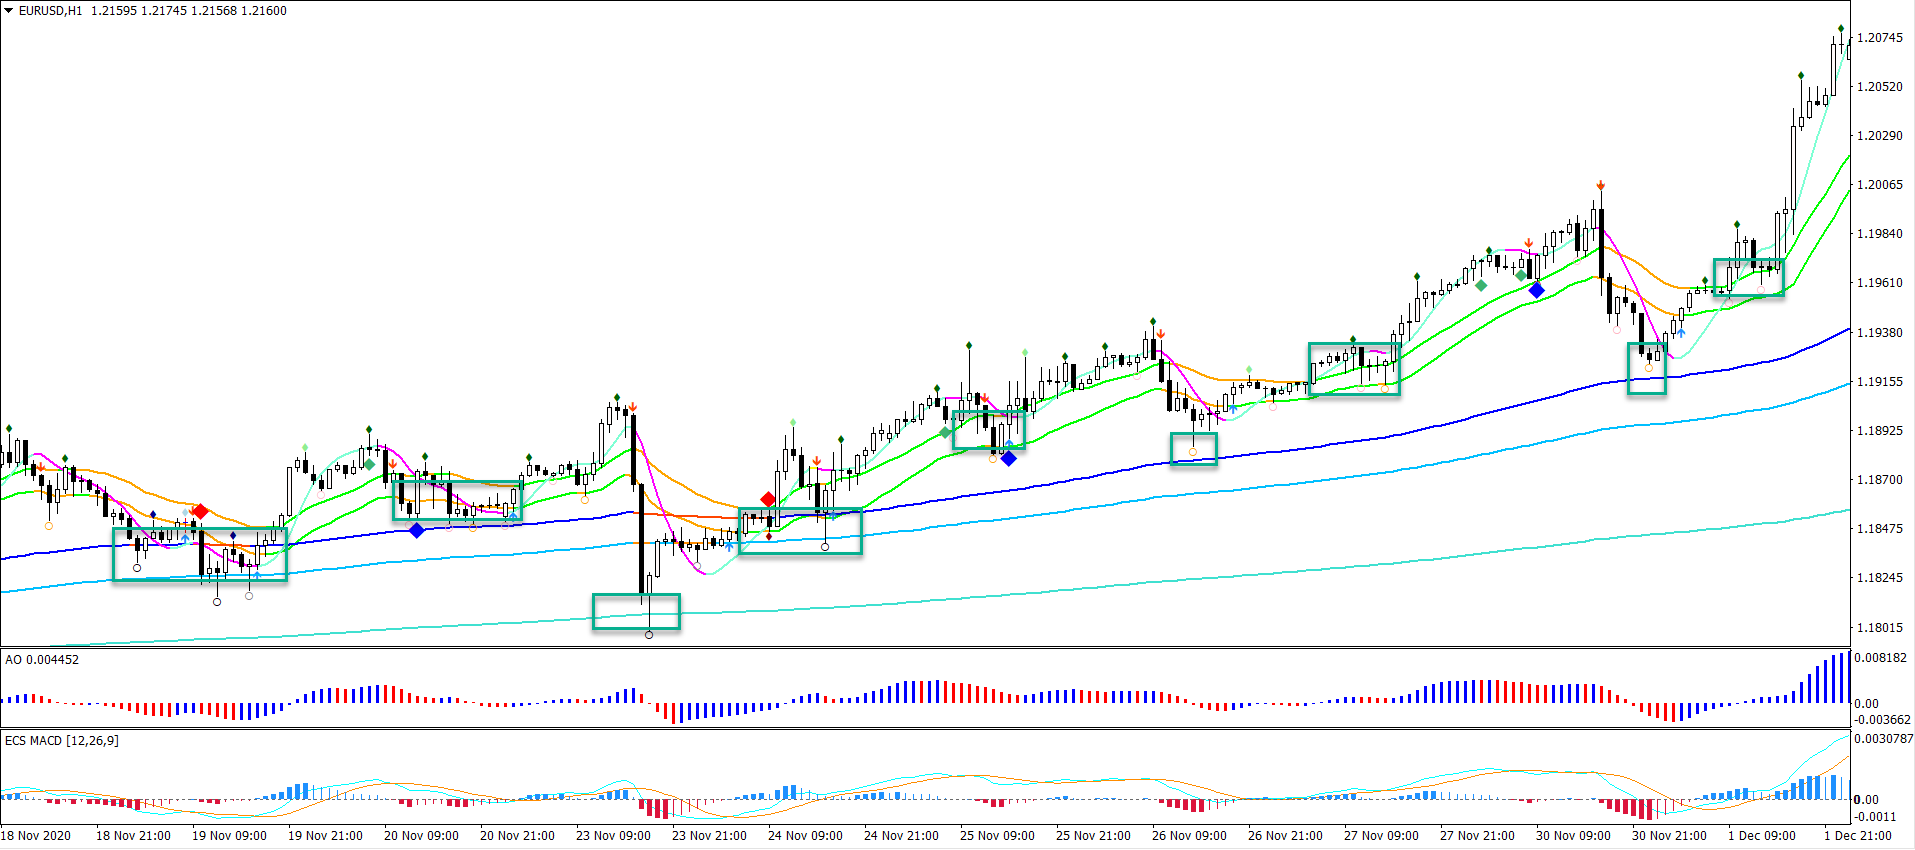
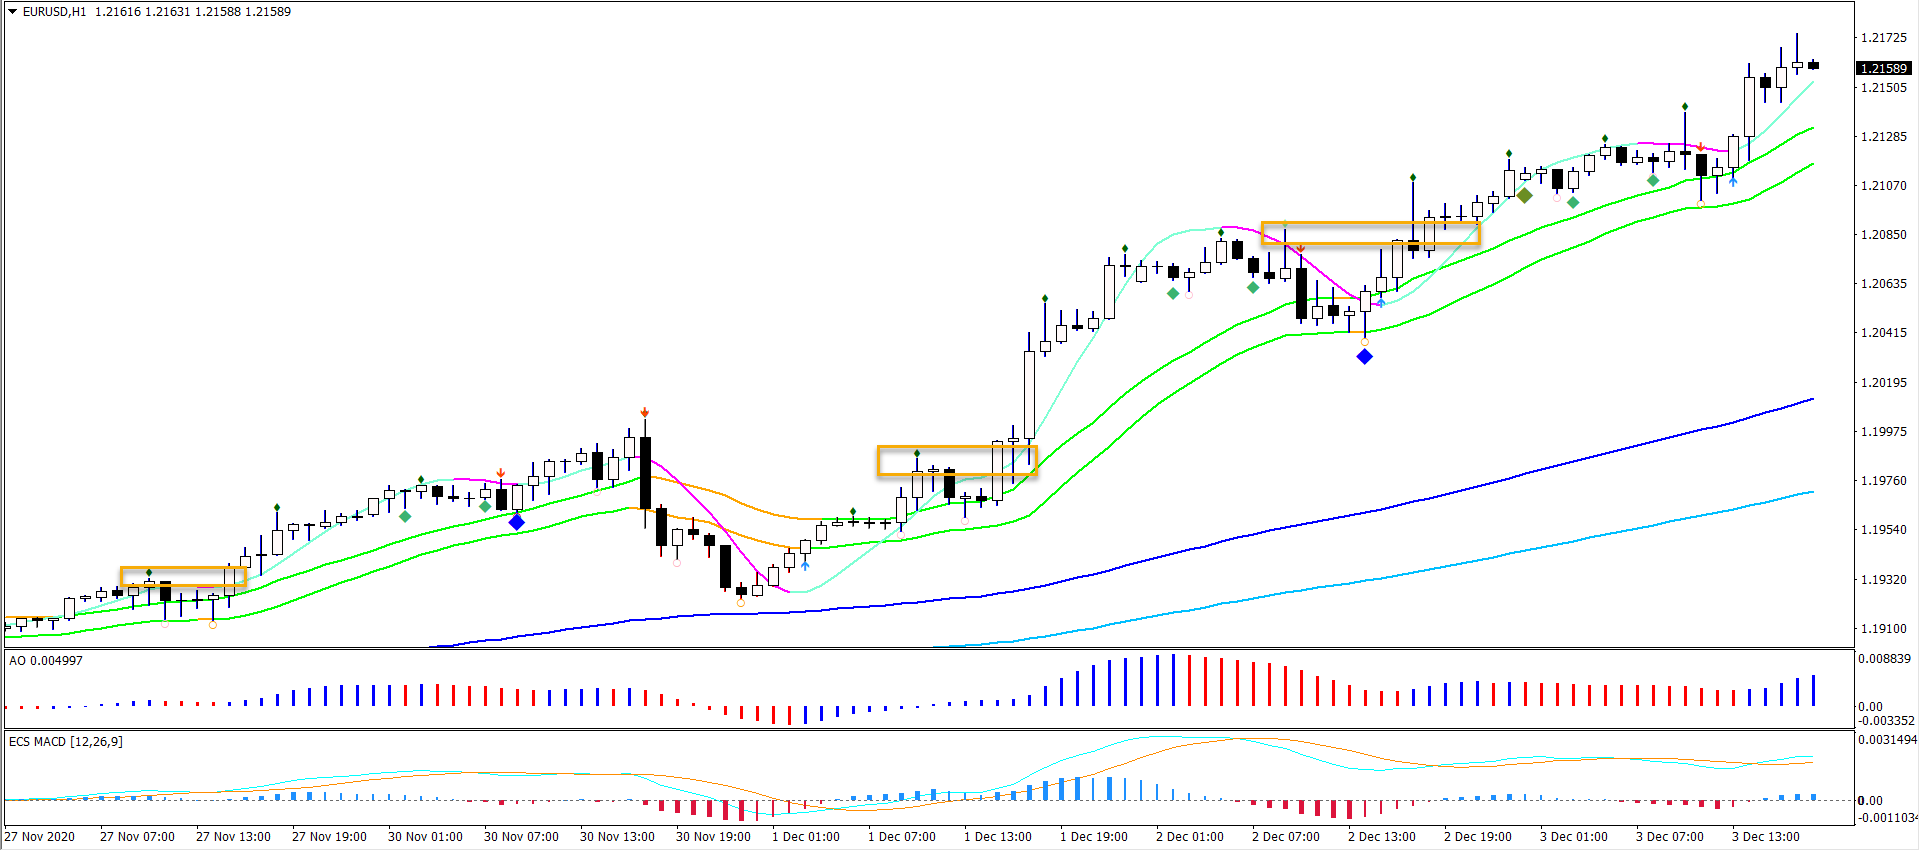
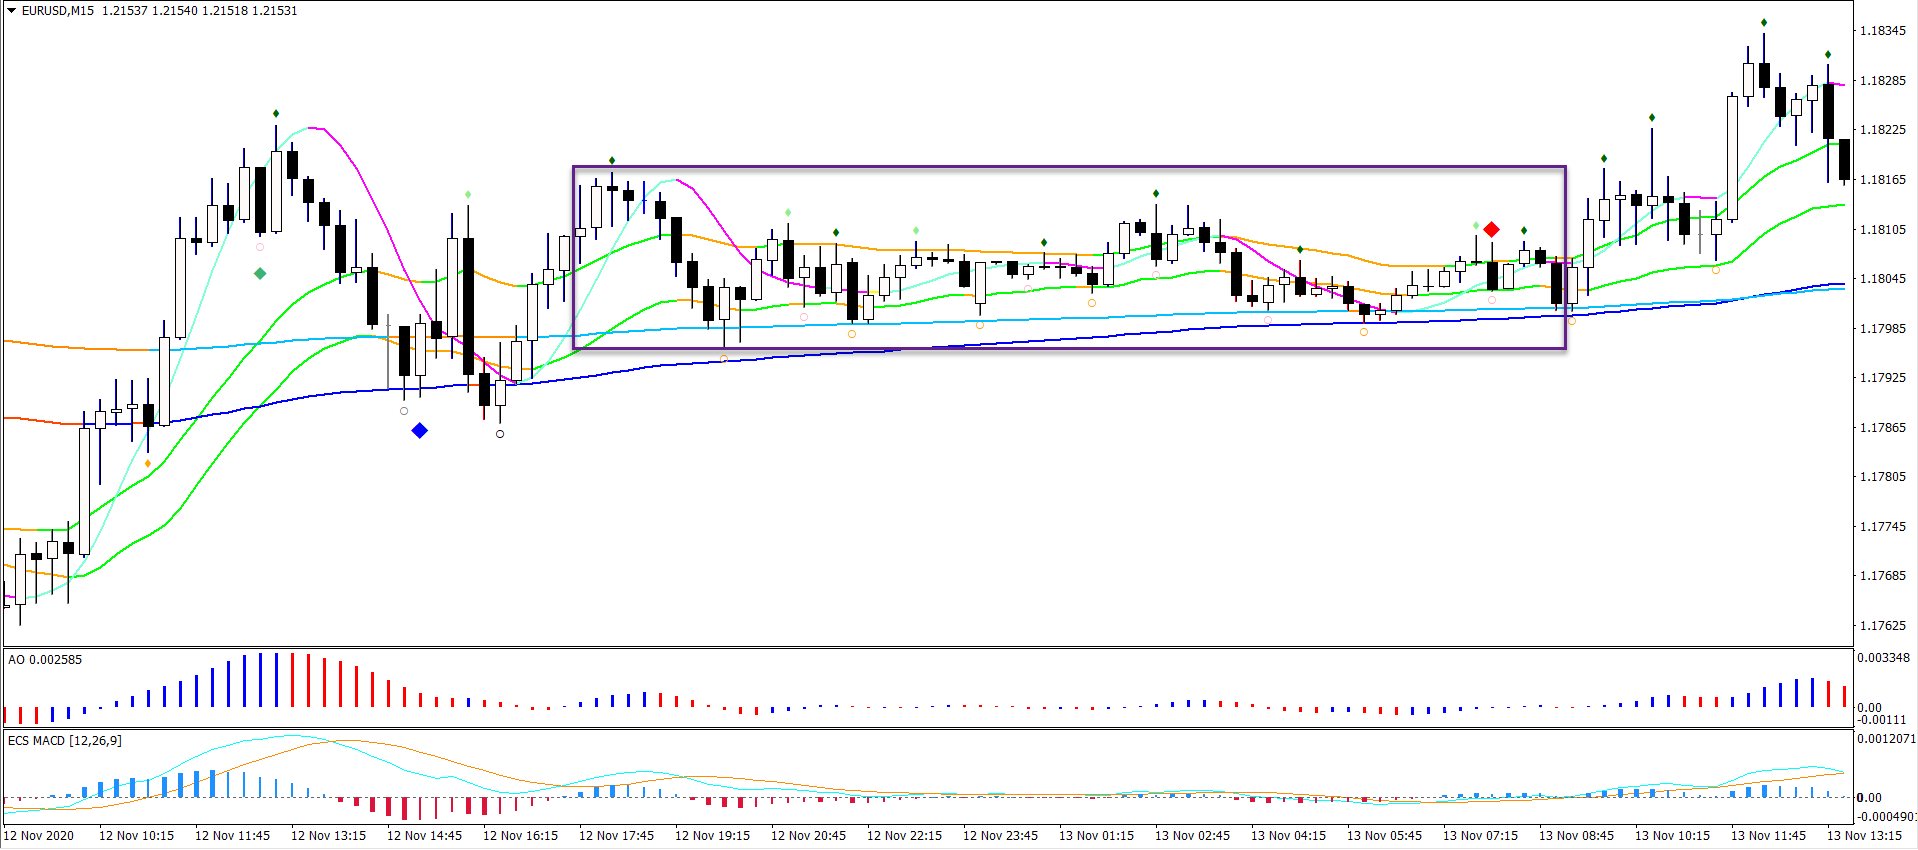
Let’s try a little experience: can you guess the time frames of the two images below (without looking at the answers)?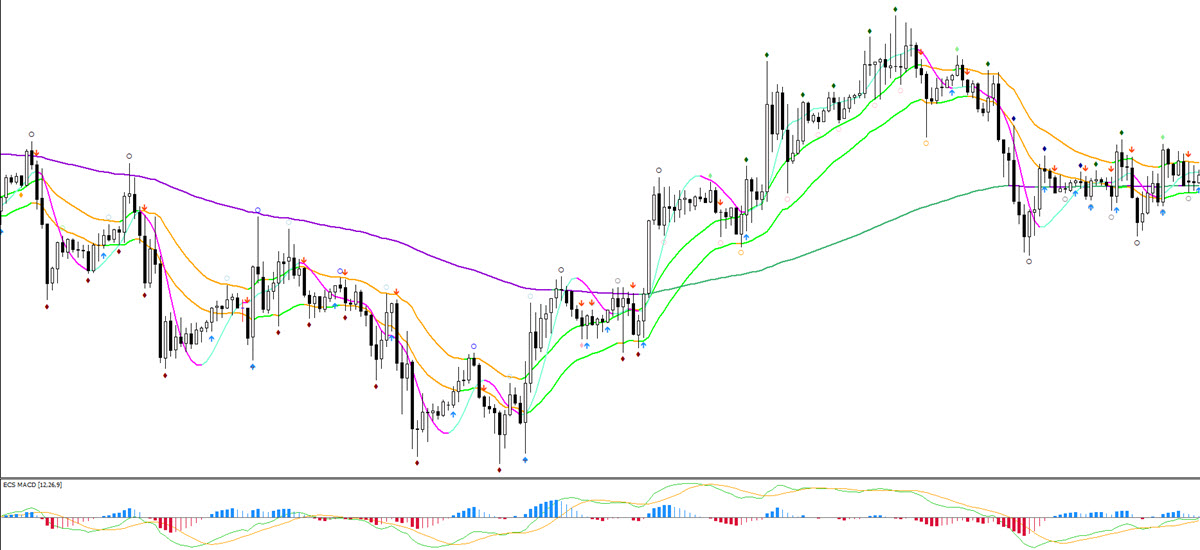
The time frames are a 1 hour chart (1st) and a 15 minute chart (2nd). Perhaps you guessed the answers correctly, but in any case, I believe that my point is clear: readers can see that both images look very similar.
Patterns that repeat in a similar way on all scales are called fractals (we are now referring to the idea of a Fractal, not the indicator (the indicator is based on the concept too)).
The fractal nature of financial markets is in many ways similar to the fractals found in… music notes, sea coast lines, and nature such as snowflakes, shells, flowers, crystals, lightening, and food (broccoli).
So what do music notes, snowflakes, the sea coast and the charts have in common?
They are all fractal in nature.
Price Fits within Fractal and Chaos Theory
All of these Fractal shapes might appear chaotic and random but they are actually more organized than we expect…
At least that is what the “Chaos Theory” explains.
The name Chaos might make you think that the theory is chaotic… But ironically, it is the exact opposite.
Basically, Chaos Theory is theory that provides us a method to make more accurate predictions in natural phenomena such as weather and financial markets
Both Fractals and Chaos Theory are a branch of mathematics.
They focus on the behavior of dynamical systems that are highly sensitive to initial conditions.
Chaos Theory indicates that there are 5 aspects within apparent randomness of chaotic complex systems:
- Underlying patterns: movements that behave in a similar way.
- Constant feedback loops: an action reinforces a certain direction.
- Repetition: repetitive movements.
- Fractals: same movements on all scales (a curve or geometric figure, each part of which has the same statistical character as the whole).
- Self-organisation: spontaneous process where some form of overall order arises from local interactions between parts of an initially disordered system.
The “butterfly effect” describes how a small change (in a deterministic nonlinear system) can result in large differences to a later state.
- The most known example is how a butterfly flapping its wings in the Amazon can supposedly cause a rainstorm in Texas.
- Chaos behavior exists in many natural systems, such as weather and man made ones such as road traffic.
This might sound complicated so let’s focus on trading…
How Chaos and Trading Interact
Chaos Theory is an equally relevant theory for financial markets and price action, because they also show underlying patterns, constant feedback loops, repetition, fractals, and self-organisation.
This means that charts behave in accordance with the characteristics of chaos theory (these 5 aspects define Chaos Theory).
Let’s review all 5 aspects of the Chaos Theory in relationship to price:
- Underlying patterns: the charts have a wide range of price patterns, such as divergence patterns, chart patterns, time patterns, waves patterns, candlestick patterns.
- Constant feedback loops: buyers and sellers are creating loops of feedback (concepts such as chart patterns, impulse and range).
- Repetition: the market movement, price patterns, and support and resistance levels are used and repeated over and over again.
- Fractals: price action moves in the same way on various time frames and markets.
- Self-organisation: lower time frames provide information about the movement on higher time frames (5 waves on a lower time frame indicate an impulsive wave on a higher time frame).
Patterns repeat (fractals) and allow us to look deeper at the true market structure, which is not as random as it might seem (chaos theory). The financial markets are just not (as) well understood without these concepts.
But traders can understand the markets better by using the 5 concepts of Chaos Theory:
- The price movements occur on all time frames (fractal).
- Repeat themselves (history repeats itself).
- Impact higher time frames (self-organisation).
- Create feedback loops (of buyers and sellers).
- Are full of underlying patterns (chart patterns etc).
To us, it makes sense to analyse the chart and price patterns via the primism of Fractals and Chaos Theory.
The definition of a complex system works extremely well for explaining the nature of the financial markets and the corresponding price charts.
The Chaos Theory teaches traders that they can understand the underlying price movements by analysing the chart itself with its price patterns, fractals, price repetition (trend, S&R), wave patterns, and chart patterns.
In our view, traders are able to understand, analyse, and forecast better by analysing these patterns (based on the theories of Fractal and Chaos).
Benefits of Chaos for Trading
This is why understanding the price movements in finding the best trade setups. Patterns are important from both a practical and theoretical point of view:
- Practical for understanding the path of least resistance.
- Theoretical because they fit within the theories of Chaos and Fractals.
By using price patterns, chart patterns, trend, momentum, S&R, and price action, we can understand:
- The path of least resistance.
- Where the decision zones are located.
- When to confirm or invalidate the development of patterns and analysis.
- When to enter trade setups if desired.
- When to apply trade management if needed.
Indicators and tools help us determine the path and decision zones and locate setups and exits that provide us a long-term advantage. As this book has mentioned, we use indicators and tools such as swat.FRACTALS, moving averages, ecs.WIZZ, Fibonacci, swat.CANDLES, candlestick patterns, chart patterns, etc to analyse the charts, find decision zones, determine trade direction, setup triggers, find entries, and manage trades.
Here is an overview of the tools that can be used per category.
- Underlying patterns: divergence patterns, chart patterns, time patterns, waves pattern, and candlestick patterns.
- Constant feedback loops: concept of trend / momentum /range, moving averages, ecs.WIZZ, swat.CANDLES, swat.ARROWS.
- Repetition: support and resistance, Fibonacci, moving averages.
- Fractals: swat.FRACTAL indicator, multiple time frames.
- Self-organisation: wave patterns, multiple time frames.
We think that some extra information on feedback loops makes sense.
- The first type is the positive feedback loop. For example when the US Dollar is showing positive economic statistics or news, it often causes the USD to go up. When the price in fact does go up, then investors/traders believe that the news is having a positive effect on the price, which could cause it to go up even more. Basically, this causes positive news regarding the price which causes the price to go up.
- A negative feedback loop is two negatively correlated variables. When one goes up, then the other goes down. Traders might expect good news but the actual news is not as good as expected.
These are of course just short-term examples. The same however is valid for long-term economic fundamentals of a country and its currency and technical analysis too.
Both feedback loops occur regularly. The positive feedback loop creates trends and one directional price movements. A negative feedback creates a range and sideways price action.
Positive: price rises → traders buy → prices rise → traders buy
Negative: price rises → traders sell → price falls → traders buy
Patterns Remain a Probability
Whether price patterns play out within the expected path of least resistance always remains a probability and is never a guarantee.
Some price patterns will play out as expected and confirm the expected path of least resistance whereas other patterns become invalidated and fail.
Price patterns and price movements can always confirm or fail compared to the expected pattern and compared to how we analysed the charts.
There is no way that traders can ever be 100% sure about the development of a particular pattern or trade setup. Simply said, the markets remain vulnerable to changes.
You might be wondering:
- How come nothing is certain in the financial markets?
- And if nothing is certain, how can you forecast anything?
Forecasting is not about being right or wrong about one isolated event. Everyone can be lucky at one occasion.
In many ways, forecasting the weather is in my eyes similar to trading the markets.
- Meteorologists are nowadays very skillful in forecasting the weather patterns in the upcoming 7 days (short-term).
- Studies show that their forecasts are very accurate, as mentioned in the book “Superforecasting” by Dan Gardner and Philip E. Tetlock.
- For instance, when there is a 30% chance of rain, then 3 out of 10 days do indeed have rain and 7 do not.
- The accuracy is just as accurate for all forecasts across the spectrum with the exception of low probable events between +/- 0 and 10%.
- The reason for the slight inaccuracy with low probable events is that the weathermen are actually correcting for our human bias because humans tend to regard a probability of 0-10% as “impossible”.
The Forex market is similar to the weather because traders also can calculate the probability of their strategy working out in the long run. Each strategy will have a historical win rate of 70%, for instance. This will vary of course from strategy to strategy. Although traders know that historically speaking they will usually win 7 out of 10 trades, there is no way for them to know when the winning setup will occur. It is impossible to find out whether the next trade will be a win or a loss.
The weather and Forex strategies work in the same way. A 70% chance means that 7 out of 10 days will be raining and 7 out of 10 trades will be winners, but we just don’t know when that will happen. Will that be today or this trade or rather the next?
The main point is: not being able to predict one particular outcome with 100% certainty does not block the ability to perform accurate forecasting:
- Weather: 70% chance of rain means that on +/- 70 out of 100 days, there will be rain and on +/- 30 days there will be no rain.
- Trading: 70% win chance with a strategy means that, as long as we trade each setup with the same approach, traders will win +/- 70 out of 100 setups.
Conclusion: in the areas of trading and weather, the next isolated event can never be predicted but the probability of particular situations (70% rain chance i.e.) can be forecasted with precision when analysing the long-term.
Which situations qualify?
The accuracy of forecasting weather dramatically drops after 7 days. Weather forecasts beyond those 7 days are inaccurate and in fact, using the average climate data of the year provides a more accurate estimate. In weather the accuracy of forecasting is limited to 7 days.
In trading I think that a similar number (7) works pretty well too. In any case, the general idea and concept does apply well to the price charts. The accuracy of technical analysis is more precise in the short-term than in the long-term. Why? The further away we try to analyse from the current candle, the more difficult it becomes because there are more factors that can change the path of least resistance. New information continuously changes the most likely path of least resistance. A trader who is looking further into the future will have to deal with more variables and unknown factors, which can change the path of price and its expected path of least resistance.
What is short-term and long-term in trading? I like to use the same figure (7) as in weather but for counting candles. So anything up to 7 candles is short-term and easier to forecast than looking beyond 7 candles. This means that what qualifies as short-term is dependent on the time frame too. A daily chart indicates that anything up to 7 days is short-term (7 weeks on weekly chart, 7 hours on hourly chart, and 105 minutes on 15 minute chart).
This is one of the reasons why the SWAT method uses time patterns and Fractals that have values quite close to 7. Our swat.FRACTALS and time patterns are based on 5-6 candles. We also use similar numbers for our trade management ideas (be patient with the trade at the beginning during phase 1).
Generally speaking, traders can use these fractals, patterns, and tools to evaluate which trades have an edge in the short-run. And if they repeat those setups again and again, they can check whether similar setups show long-term consistency and profitability.
Many trades do not necessarily close in the short-term (within 7 candles), which is why we are in favor of using active trade management based on the new information available at the right time (not too soon, not too late).
It is important that traders keep in mind that the long-term results are more important than the performance of any single setup. Traders need at least 40-50 trade setups before they can make any judgment about any strategy or entry method. Anything less then 40-50 setups is just too random.
Traders therefore must keep two goals clearly in sight:
- PROBABILITY:
-
- See trading through the lens of probability.
- Nothing is certain.
- Keep trading the same way, unless your long-term results are questionable.
- TRADING PSYCHOLOGY:
-
- Manage your emotions during the life cycle of a trade setup.
- Manage your emotions during small dips (streaks of losses).
- Keep trading the same way, unless your long-term results are questionable.
Generally speaking humans are weak in two aspects, which is why trading is often so difficult for traders:
- Assessing probabilities. People tend to believe that a 30% chance of rain means that there is in fact 0% chance of rain. Of course, in reality, the actual chance is 3 out of 10 but people struggle to comprehend probability.
- Accepting losses. The pain of a loss is psychologically much more difficult to accept than the pleasure from a win. More on this will be explained in the part on trading psychology.
Probability is a difficult concept to comprehend and most people tend to overestimate something that is very unlikely or underestimate something that is actually quite likely.
- Unlikely events: the author Rolf Dobelli mentioned in this book “The Art of Thinking Clearly Book” that people respond to the expected magnitude of an event, but not to its likelihood. He added that humans lack an intuitive grasp of probability, which leads to errors in decision making.
- Likely events: the same example of a 30% chance of rain works great as an example. In fact, a 30% chance of rain is actually quite likely but many people complain about the accuracy of the weather forecast if it does rain on such a day.
- Conclusion: 30% chance of rain of a likely event is seen as unlikely (point 2) but a 0.1% or 0.01% chance of unlikely event seems likely (point 1). Humans have difficulties in correctly assessing and using probabilities for their decision making.
- Impact on trading: this human bias impacts the decision of traders as well. Traders are known for:
- Overreacting to new information on the chart: a small change on the charts might make a trader think that the odds have significantly shifted.
- Underreacting to new information on the chart: a large change on the charts might not receive enough attention from a trader.
- Focusing on being correct: traders tend to care only about the win percentage being as high as possible, even though this increases the chances of losing big when things go wrong. The correct approach focuses on profitability which is a combination of win percentage and the avearge win versus average loss ratio.
- Focusing on winning the current/next setup: traders tend to care whether the current or next setup is a win. The correct approach is to focus on the consistency of long-term (40-50 setups at least) results.
Why Do Patterns and Analysis ‘Fail’?
Although many chart patterns are surprisingly reliable for predicting the next price move, they are not a dead certain either.
That’s because they can morph seamlessly into a different pattern from what one might have expected.
We can only ever know for sure what pattern has formed in hindsight because by the time it is 100% confirmed, the trading opportunity it would have provided is already over.
Trading is a continuous analysis of the path of least resistance, which can change as price action and the chart provide new information. This new information changes the old perspective and makes your analysis, your trade idea, your open trade setup, or the price pattern more or less likely. This in turn impacts the expected chances of a setup.
A concept found in quantum physics / mechanics has a remarkable parallel to chart patterns and trading. It is called ‘wave function collapse’.
- Put very simply, wave function collapse is the moment when a particle of matter first becomes measurable or definable in any way (i.e. it ‘collapses’ from a potential into something observable).
- Prior to that, it exists more in an undefined state of potentiality, where it could still turn out to be one of several things.
- However, quantum mechanics can to a certain degree predict in advance how a ‘wave’ will collapse into a particle.
We engage in a very similar process when we trade chart/wave patterns. We can predict what price is going to do next to a certain degree.
But the pattern will never be 100% confirmed until after it has played out. There is a certain sweet spot; a moment when just enough price-action has played out to validate our analysis, while it is also still early enough to make the trade entry viable.
That’s why it is better to be more selective with the setups you choose (i.e. choose only the best). Once we are committed, we have to trust in the quantum vacuum, the field of potentiality, to deliver the final result.
That is why it is a best practice to keep analysing the new information available on the chart because it provides new information about whether the observable is forming the pattern or wave that you expect.
To make sure that we are analysing the charts based on reality rather than on a clouded judgment based on our bias, it is important to use invalidation and confirmation levels and invalidation and confirmation patterns.
Here is a summary of the 7 steps mentioned in chapter 11 on decision zones:
- ANALYSE: triangle of analysis.
- DECIDE: like a chart or not.
- DECISION ZONE: key zone.
- DIRECTION: trade direction.
- SPACE: available space.
- TRIGGER: confirmation at decision zone.
- ENTRY: entry after trigger.
- TRADE MANAGEMENT: changes after entry.
You can use the concepts of invalidation and confirmation levels and patterns for all of these steps. Whether you use them for your analysis, for the chart patterns that you see, for deciding whether to trade, if to trade at the decision zone, in which direction, whether the space is useful for not, whether there is a trigger or not, whether an entry is still likely, or whether the open setup is working as expected.
The concepts of invalidation and confirmation allow you to setup boundaries along the expected path of least resistance and confirm whether price is still following that path or whether it is likely to move into a different path.
Once again, trading is a continuous analysis of the path of least resistance, which can change as price action and the chart provide new information. This new information changes the old perspective and makes your analysis, your trade idea, your open trade setup, or the price pattern more or less likely.
The path of least resistance can also change due to other financial markets as there is larger interdependence, interconnection, and interaction between the stock market, currency market, commodities, bonds, stock indices etc. A small change in one asset can, through the butterfly effect, cause much larger changes in the system.
Tying It Together
These are the key lessons:
- Candlesticks provide information on buyers versus sellers.
- Candlesticks and candlestick patterns make up price swings.
- Understand the importance of identifying price swings.
- Understand how to find the start and end of price swings.
- Price swings are either impulsive or corrective and bullish or bearish, which is the heartbeat of the market and charts.
- Identify price swings via AO, swat.FRACTALS, zigzag, and momentum and correction.
- Price swings make up price patterns.
- Wave analysis is just simply identifying and labelling price swings and patterns.
- Labelling price swings / waves only makes sense once you can identify swings.
- The charts are fractal in nature, repeating on all time scales. swat.FRACTAL indicators help show the fractal nature of the chart.
- The fractal nature of the charts is part of Chaos Theory, which explains that traders can understand the financial charts in a more advanced way when they are able to understand, recognize, read and interpret patterns – patterns repeat.
- The Chaos Theory also explains that:
- Charts repeat throughout time, which means trends and S&R concepts add value.
- The charts can either be in a trend (positive feedback loop), reversal (positive feedback loop), or range (negative feedback loop).
- Charts offer underlying patterns, like chart, divergence, time, wave patterns.
- Self-organize: lower time frames can impact and help explain higher time frames and vice versa.
- Price, charts, financial instruments follow the path of least resistance, which is based on repetitive impulsive and corrective patterns (Fractal/Chaos Theory).
- The chart is a continuous battle between energy (impulse) and gravity (price back to mean and average).
- Price moves away from MAs if there is sufficient force, but retraces back to MAs (like a gravitational force) once force is slower than the strength of S&R. These movements make waves.
- The path of least resistance can be analysed by using the triangle of analysis, which is price patterns, support and resistance, and trend and momentum.
- The path of least resistance helps determine decision zones, direction, triggers, entry, and trade management.
- Traders can analyse the expected path of least resistance better in the short-term, up to 7 candles, than in the long-term as more factors can affect the price path. Time patterns help traders understand the chart by allowing 5-6 candles to confirm impulse, or else price is correcting.
- The chart is our road map for understanding the path of least resistance but everything on the charts is a probability.
- The probabilities of patterns playing out can change depending on new information.
- Patterns and the path of least resistance can change, which is based on the ‘Wave function collapse’ from quantum physics.
- The most difficult part is identifying the correct pattern and understanding when the patterns are likely/looking to break down (fail) or be confirmed. Once you can identify it, then you can trade it.
- Use invalidation and confirmation levels and invalidation and confirmation patterns to place boundaries on the expected path of least resistance.
- If price stays in the path, then the path of least resistance is being confirmed.
- If prices move away from the path, then the current path of least resistance is (being) invalidated and a new path becomes more likely.
- The patterns create a trading bias. But you need a bias to trade. Trading without any bias will mean lack of commitment to the trade. Use invalidation and confirmation levels and invalidation and confirmation patterns to base your analysis and trades on reality.
- Base your bias on patterns and analysis and use it to build up experience.
F. How to Learn More from Elite CurrenSea
Did you enjoy our guide?
- Please write your feedback on Forex Peace Army and Trustpilot.
- Check out our SWAT ebook with almost 600 pages for just 24.95 euro to learn everything mentioned in this article and more.
- Our live webinars each week.
- Send us your questions via the form.
- Check out our blog with daily analysis and updates.
Thank you and good trading,
Chris Svorcik
ecs.SWAT creator
Elite CurrenSea co-founder


Leave a Reply