Schaff Trend Cycle (STC) indicator explained

The Schaff Trend Cycle is a technical indicator for online financial trading that allows traders to catch market cycles. The Schaff Trend Cycle or STC aids traders in detecting potential market cycles and trend reversals. STC combines several moving averages and oscillators to create a single indicator line that can help in making wiser trading decisions.
Understanding the Schaff Trend Cycle
The STC is a composite indicator that measures the cyclical nature of price movements in financial markets. It is designed to reflect potential trend changes and is based on the concept that markets move in cycles and as a result, provides traders with greater insight into markets than other alternatives.
A Brief History of STC
The Schaff Trend Cycle (STC) indicator was named after its designer, Doug Schaff. He refined traditional moving averages and oscillators to create something more profound and useful. STC has a primary goal of providing more accurate signals for traders by smoothing market noise and focusing on cyclical trends.
How to add STC to TradingView charts
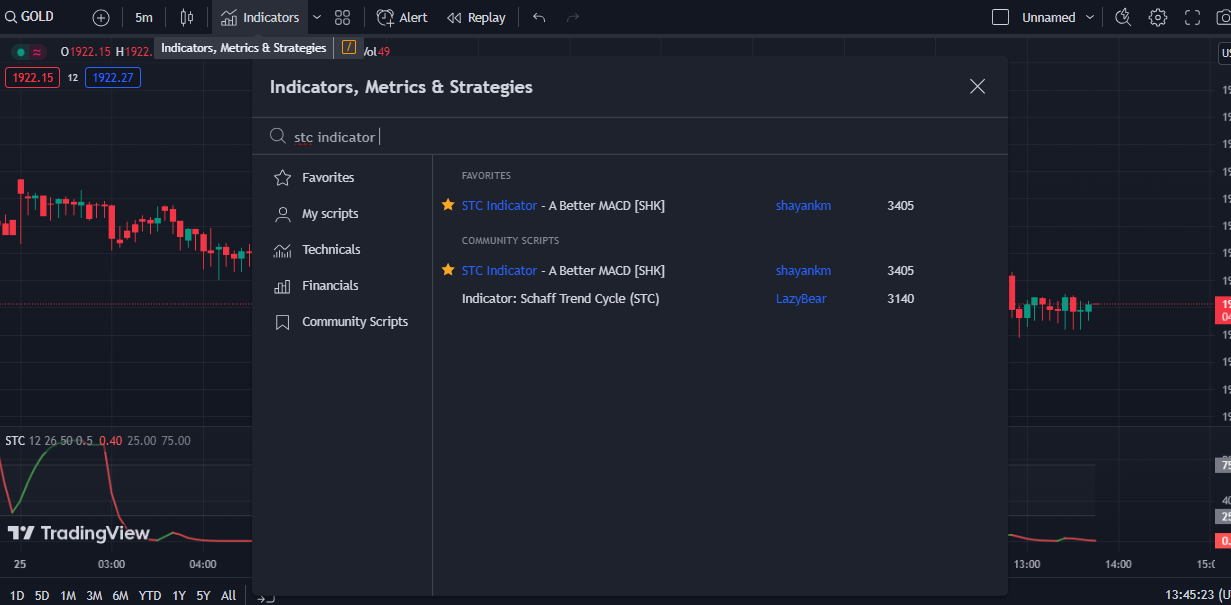
It is fairly simple to use the STC indicator in TradingView charts. You can easily add a variety of STC indicators, developed by numerous traders and developers, directly from the indicator search bar. After you find a list of indicators, just click on any one of them to add it to your chart. Traders can tweak its settings to suit the indicator to their trading strategies and timeframes.
STC for MT4 and MT5 explained with a guide
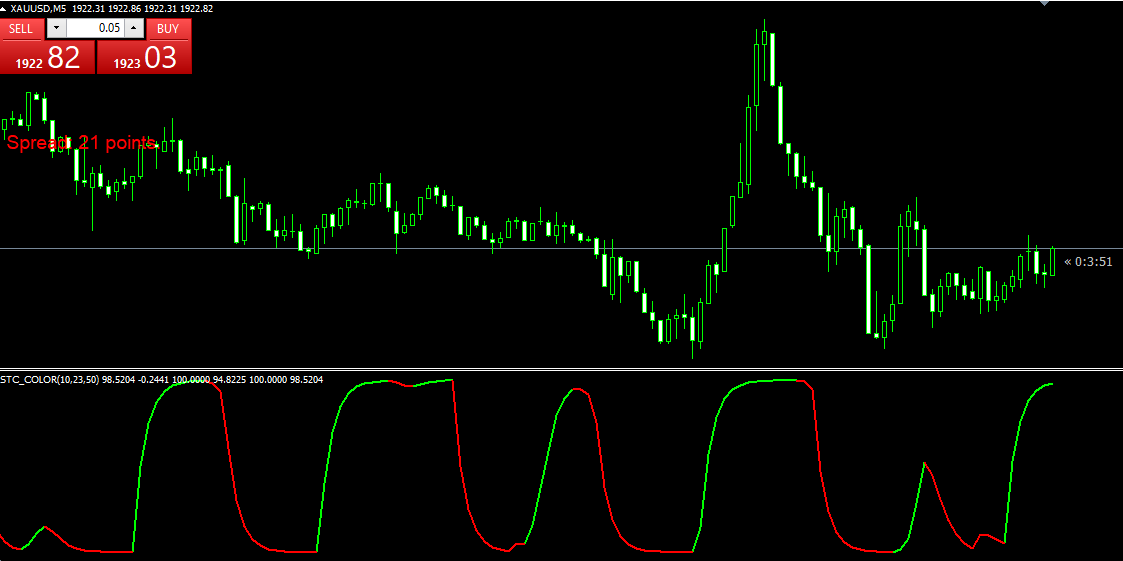
Traders can also use the STC indicator on the MetaTrader 4 and MetaTrader 5 platforms. The indicator is not built-in, so traders will have to find the indicator online and install it on their preferred platform.
STC vs. MACD
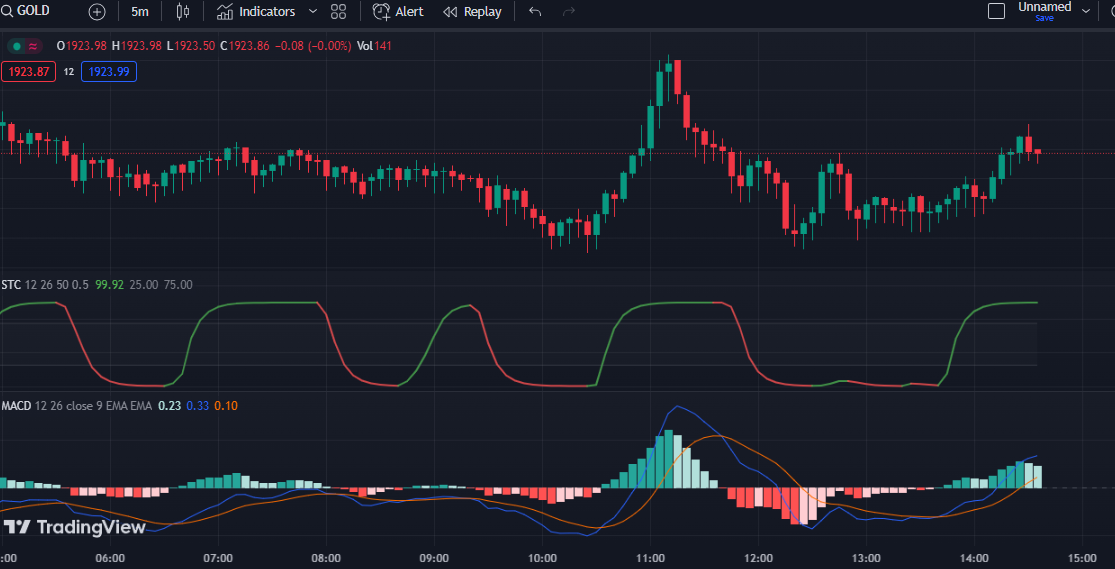
Both indicators are similar in showing oversold and overbought levels and being oscillators. They both are momentum indicators, but they differ in their calculation methods and focus. While the MACD (Moving Average Convergence Divergence) emphasizes the convergence and divergence of moving averages, STC is more geared toward identifying cyclical trends and potential reversal points.
STC, when compared to MACD, is smoother and simpler to recognize visually. The one we used in this example is the colored version, where the indicator line changes color depending on the bullish and bearish momentum. Because of this, STC seems much simpler to use in trading, as it clearly shows when the price is in the bearish or bullish cycle. Both indicators use the same two moving averages and have somewhat similar output, but are different visually. STC is better at recognizing trend changes quickly and has less noise and false signals when compared to MACD which acts more like a crossover of moving averages. The default MACD indicator in TradingView is different from the MT4 versions and is better visually. This little difference can mean significant advantages for TradingView users.
STC Indicator popular trading strategies explored
Numerous types and kinds of trading strategies incorporate the Schaff Trend Cycle indicator. Some common approaches include using STC crossovers, overbought and oversold conditions, and divergences to make trading decisions. Traders may also combine the STC indicator with other technical indicators and even price action analysis to enhance their strategies. Combining STC indicators with other indicators is highly advised as all indicators including STC will not produce profitable signals alone.
Simple STC Strategy
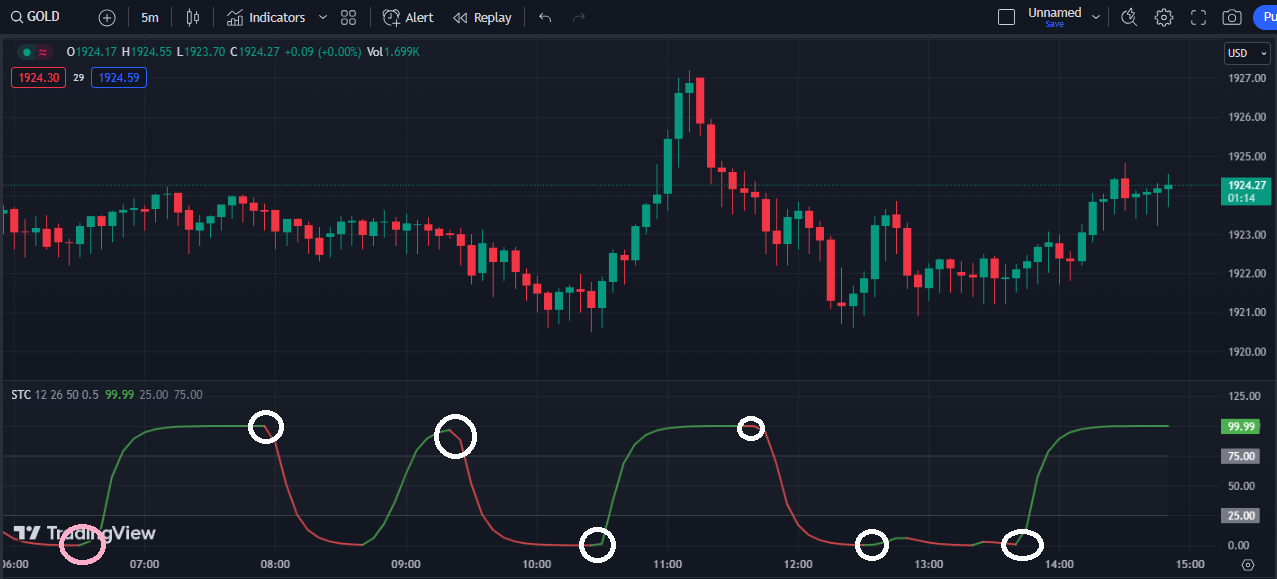
This strategy is something even an absolute rookie will nail in execution. Whenever the STC indicator changes color, aka direction, it indicates a possible cycle change from bearish to bullish and vice versa. This could also be a good time to catch the upcoming opposite movement. However, beware of false signals if there is a strong trend in any direction. Sometimes the indicator indicates a signal, but the market is sideways and there is no significant movement in the signal direction. In this case, it is essential to trade during high liquidity and medium volatility.
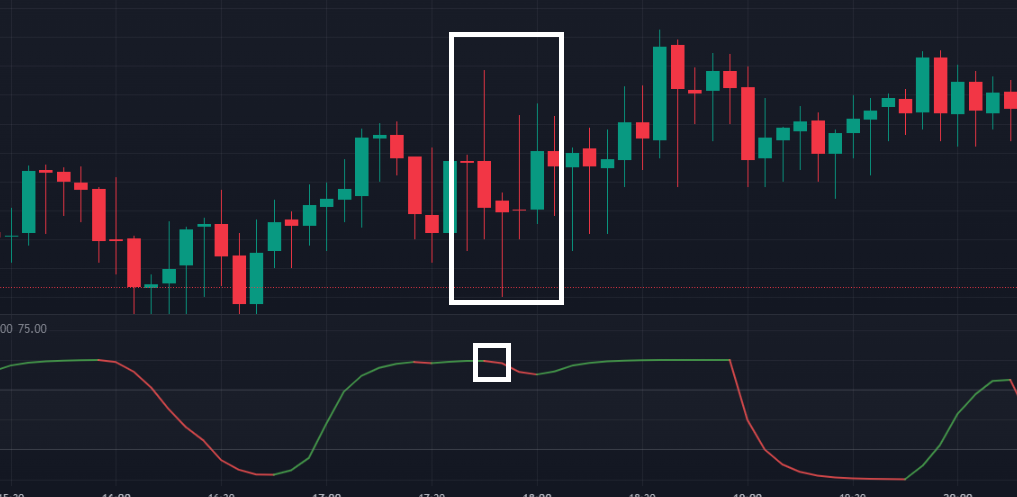
Trading with STC during periods of extremely low or high volatility can be risky, as it increases the likelihood of significant price swings generating false signals. To mitigate this risk, one effective strategy is to abstain from trading when the candlesticks exhibit extremely large size.
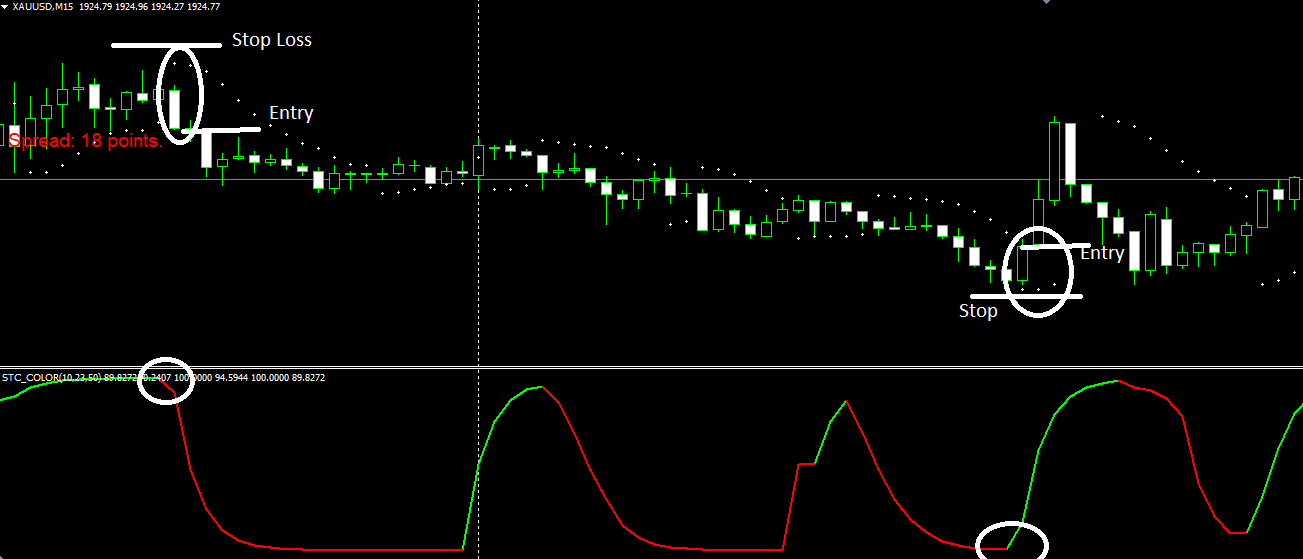
Set stop loss at the peak or bottom (higher swing and lower swing) of the current swings, and target at least 2 times the risk. In this case, even if you have a win rate of 50% you will make money. As you can see, the STC indicator is very robust and never misses trend switches. After knowing its cons and trading only when the liquidity and volatility are sufficient (not too high not too low) you can start testing this strategy on a demo account.
With these strategies and explanations, our readers should be able to add STC indicators to their charts and use them to their advantage. STC, especially the colored one, can greatly enhance trading experience and accuracy. With this simple explanation and clear examples, even beginners should be able to start trading on a demo account using this robust indicator.
Advanced STC strategy using Parabolic Sar
Parabolic Sar is a popular technical indicator that tries to identify potential reversals in financial markets. The indicator positions dot both above and below the price candles, serving as visual markers that denote potential stop and reversal points on the chart. When the dots switch sides, it signals a change in trend direction, making it useful for setting stop-loss levels and trailing stops in trading. Nevertheless, we intend to utilize it to confirm the signals generated by the STC indicator. By adding another indicator, our accuracy can be increased, as there is a high chance of the signal being correct when multiple indicators show the same data.
When the STC indicator changes color and Parabolic Sar switches sides, it is a good time to enter the trade. When both indicators are combined and show the same tendency, the chances of succeeding are higher. Just do not remember to use stop loss and take profit orders for every trading decision to limit risks.


Leave a Reply