Time Patterns Add 2nd Dimension to Chart Analysis & Trading

Dear Traders,
Do you focus on price movement and support and resistance levels without taking into account the factor of time?
The chart, however, offers two dimensions: price and time. While price is plotted on the vertical line, time is plotted on the horizontal line.
In a high leveraged market as the Forex market, entering a trade setup at the right price is really just half the story.
Without proper timing, your well intended analysis and great trade setup could leave you penny less. Entering a trade at the right time is equally important.
This article will explain why time factor is essential for understanding price charts and the Forex market.
The timing of impulsive price action
Impulsive price action is characterized by three aspects:
- candle closes near the high or low
- relatively large candles
- continuous higher highs (HH) and lower lows (LL).
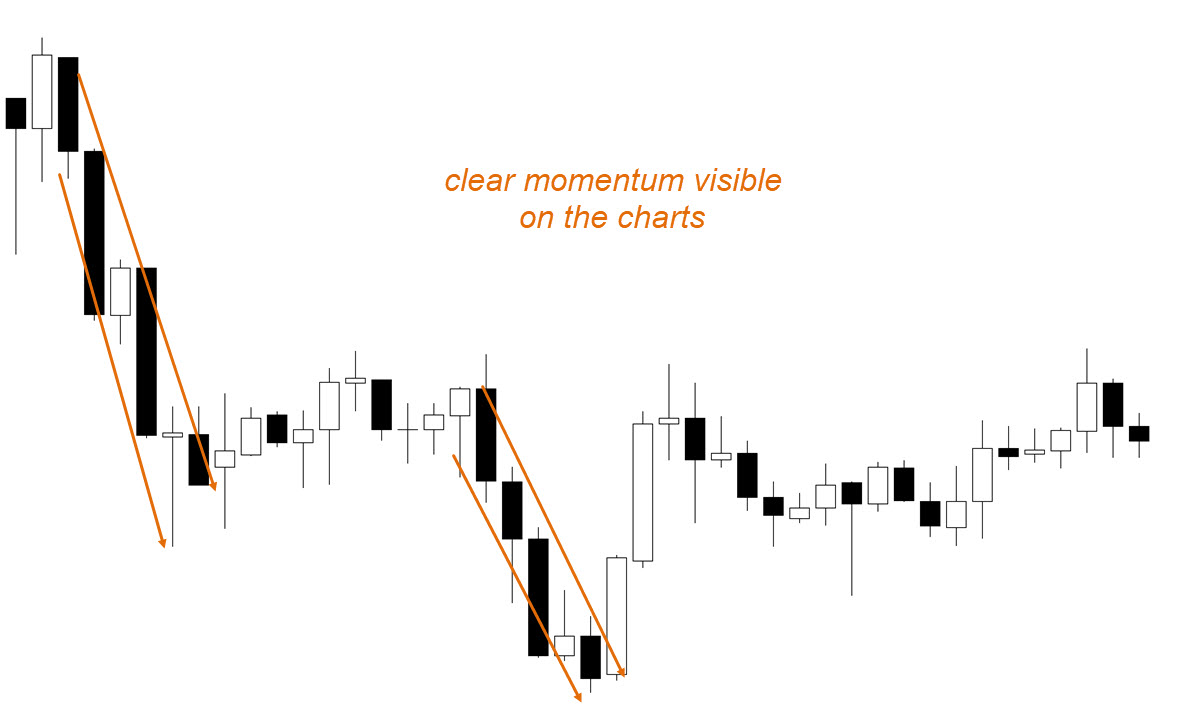
But impulsive price action is also determined by a time element.
An immediate HH or LL confirms the momentum but what happens if one candle fails to confirm a HH or LL?
What happens if 2 to 6 candles fail?
After 6 candles fail to break a high or low, momentum considered to be finished.
In most cases if 2 to 6 candles fail to break for a higher high or a lower low, then indicates:
- not a trend change but
- rather a small pause of the ongoing impulse.
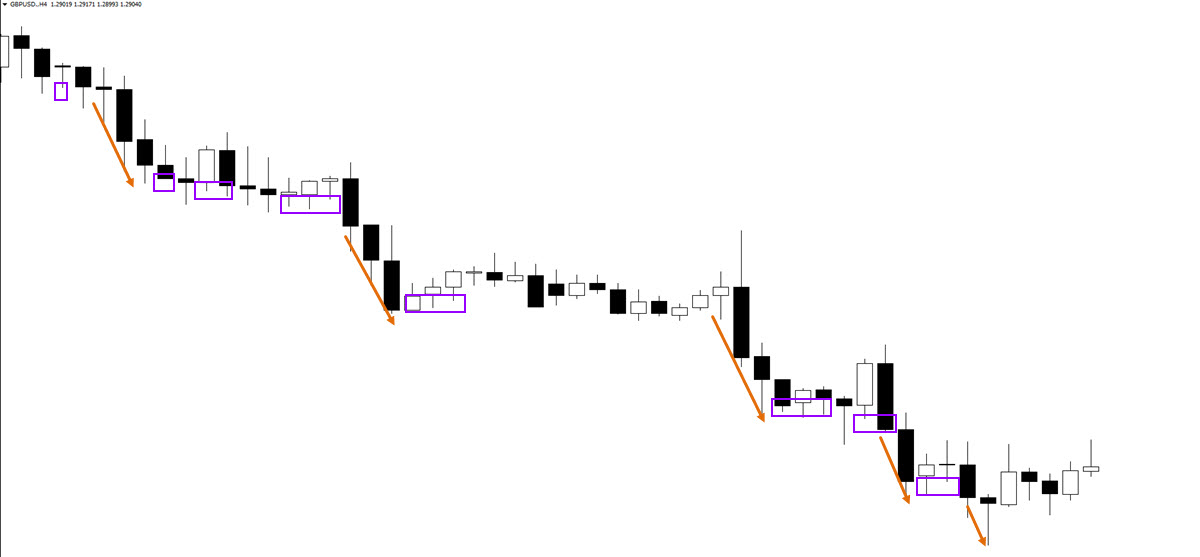
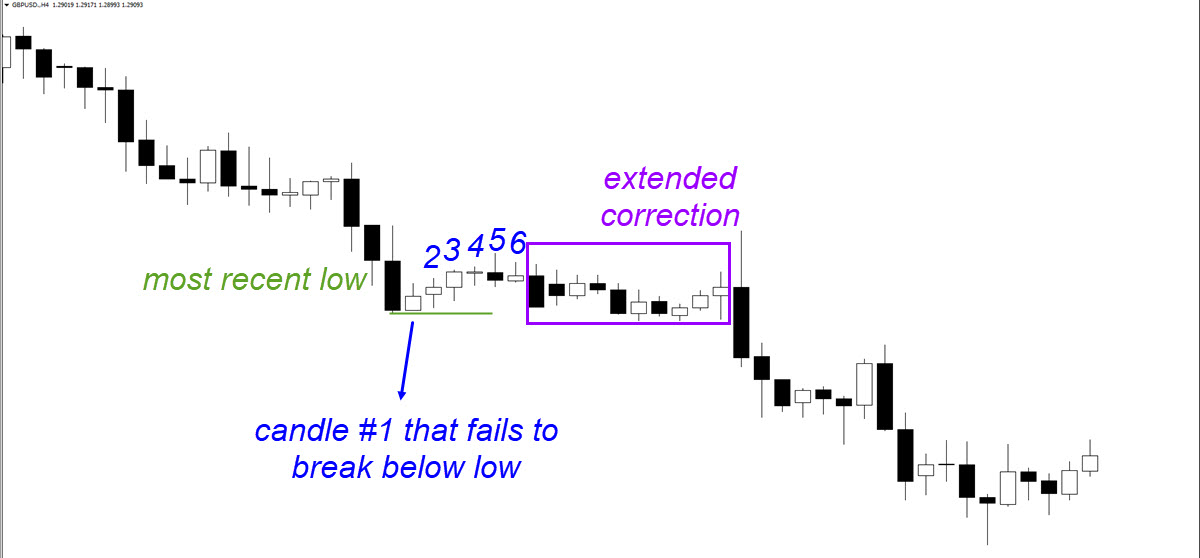
As the above image shows, price action usually makes a smaller retracement before continuing with the trend.
- The purple boxes indicate the moments where price fails to confirm an immediate lower low.
- The orange arrows show that price often continues within those two to six candles.
However, if more than 6 candles fail to break for a higher high or lower low, then this could indicate that momentum is fading and that a larger retracement has a higher chance of starting.
If 5 to 6 candles fail to break, then the current impulsive price swing is most likely finished and a corrective price swing is probably starting.
How do time patterns help traders?
Time patterns help traders with two critical aspects:
- Knowing whether the current price swing is impulsive or corrective.
- Candles showing higher highs or lower lows out of 6 candles indicates the start of momentum.
- A new higher high or lower low confirms the momentum continuation.
- Knowing when to expect and where to find the end of a price swing.
- A failure to break within 5-6 candles for a higher high or lower low indicates the end of the impulsive price swing and the start of corrective price swing.
- Counting candles or swat.FRACTAL indicator:
- Traders can simply count how many candles have failed to confirm a HH or LL.
- How do you count candles? The first candle that fails to post a new HH or LL is counted as a candle. Traders are looking for the 6th candle that fails.
- Use the swat.FRACTAL indicator:
- Green diamonds turn into light green diamonds.
- Red diamonds turn into pink diamonds.
As you can see, not only candlesticks provide key information about the impulse, but time patterns too. Via time patterns we are able to estimate the end of an impulsive price swing, which is very useful information because it allows traders to:
- Find a potentially better entry.
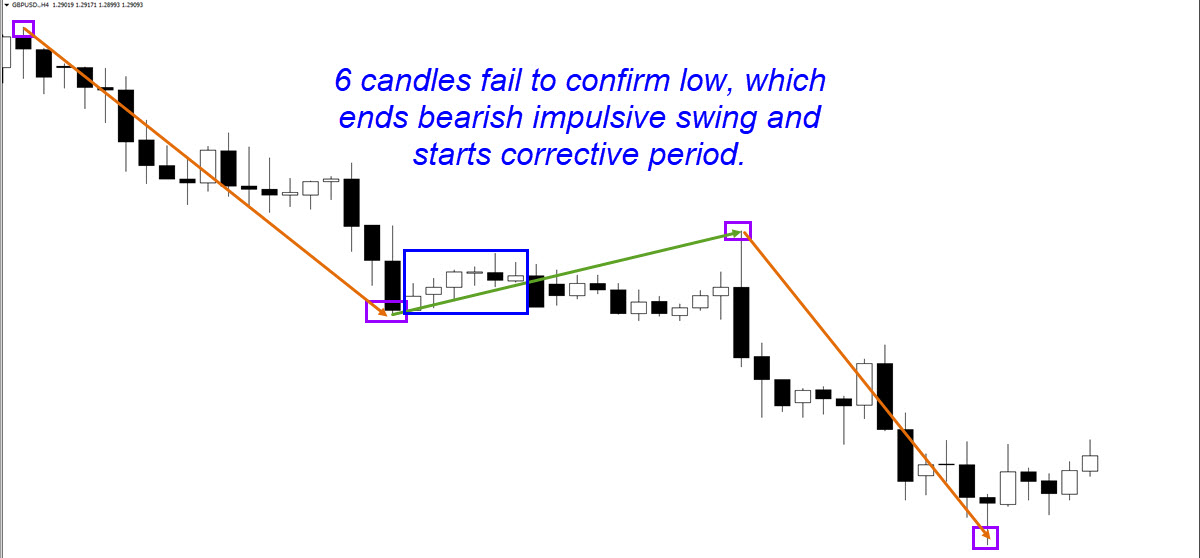
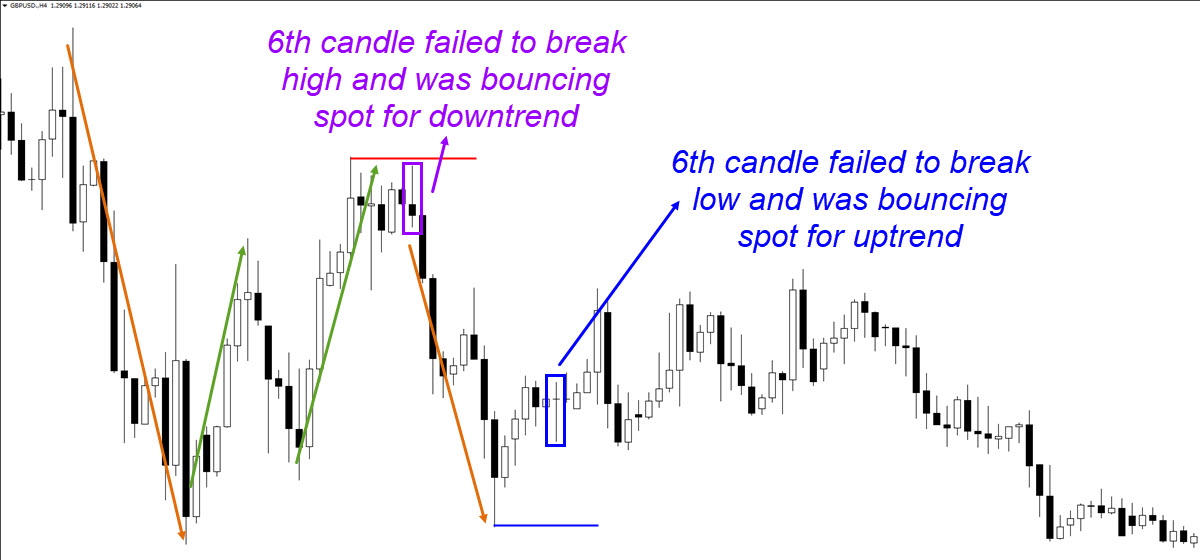
The image below shows how the price moved down strongly (impulse indicated by first arrow). Then price made a bullish correction with 2 impulsive parts (green arrows). The 2nd push higher ran out of steam as the 6th candle failed to confirm a new high, which was then followed by a significant drop back to the previous bottom. - Find a potentially better exit.
Price was unable to break below the previous bottom and a bounce occurred. Again 6 candles failed to break below the previous bottom, which indicated a larger bullish correction where price went sideways before a larger downtrend continuation occurred.
- Manage their trades with more information.
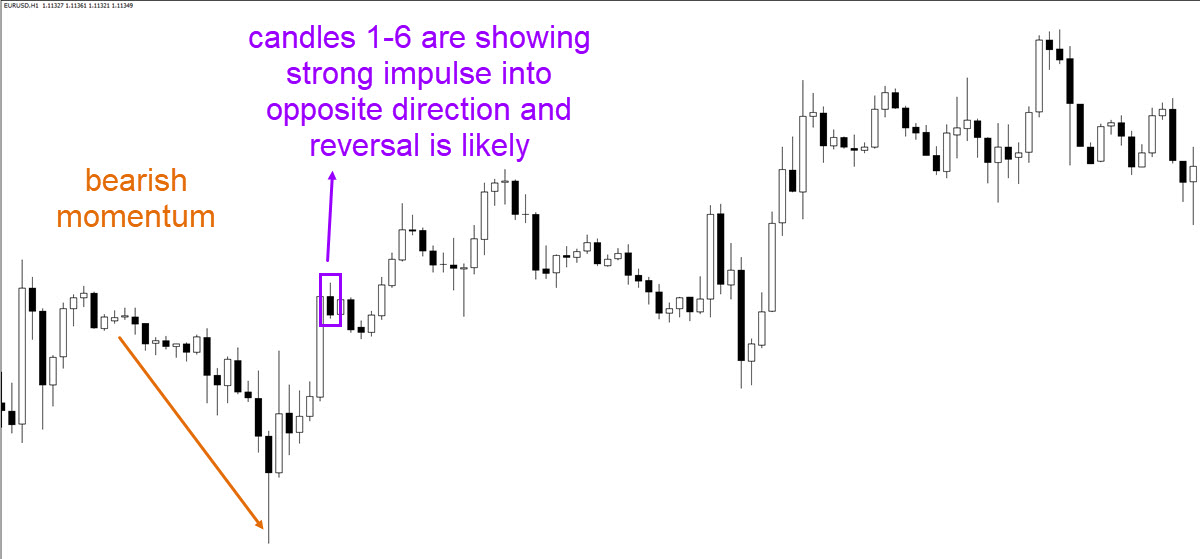
The image shows a classical break of a bear flag and decent continuation lower but then price reverts back up with strong bullish candles and fails to confirm a new low after 6 candles. This is the moment when traders want to be careful as price could enter a corrective phase. It does not mean that the trend is necessarily over but a pullback, retracement or even reversal could take place. After the 6th candle price has indeed shown another +/- 15 corrective candles that made a slight bullish angle.
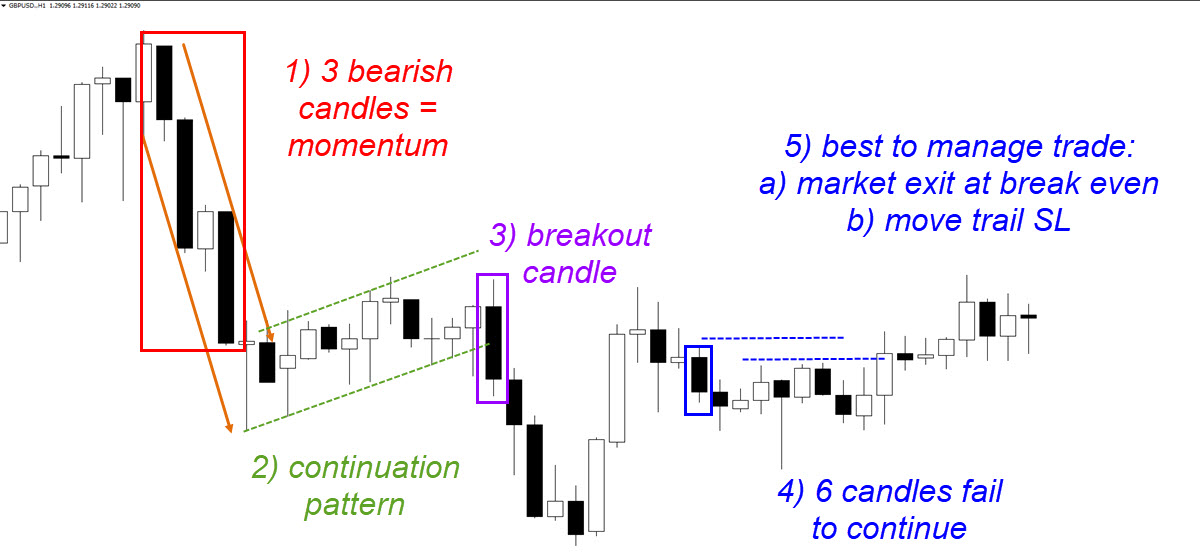
Once again, the time pattern gives us useful information about when the impulse is expected to be running out of steam.
The end of an impulsive price swing does not necessarily mean that the trend is finished. Price could simply make a correction, like a pullback or retracement within that trend, and then show a trend continuation.
The end of the impulsive price action does signal indecision and increases the chance of sideways or reversal price movement.
It means that one side (bulls or bears) had control but lost it and it remains a question mark whether they will regain it.
Impulse and correction are a critical part of wave and Fibonacci patterns, which is explained in our special Elliott Wave Patterns & Fibonacci Relationships Core Reference Guide.
Why 5 to 6 candles are critical
You might be wondering, why do we use 5 to 6 candles?
At first I only used the 5 candles as the rule but from experience I noticed that the 6th candle provides a decent breakout too in certain situations. The number 5 is based on the Fibonacci sequence and fits within the 7 day rule used in weather forecasting. Both the numbers 5 and 6 work well and I use the following rule to decide whether to use a 5 or 6 candle count:
- During bullish impulsive price action:
- If the 5th candle is bullish as well, then I prefer to wait for the 6th candle to close.
- If the 5th candle is bearish, then often the bullish momentum is finished.
- During bearish impulsive price action:
- If the 5th candle is bearish too, then I prefer to wait for the 6th candle to close.
- If the 5th candle is bullish, then often the bearish momentum is finished.
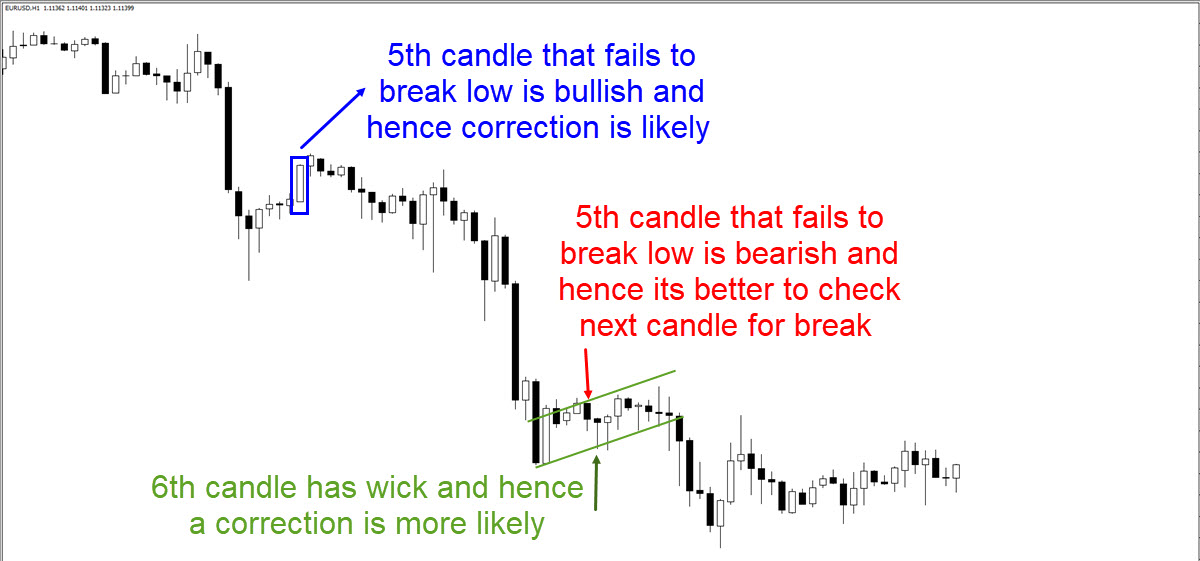
The 6th candle is usually the one that needs to break the high or low to confirm that the impulsive price swing is still active. I would only make an exception to this rule if the 6th candle has a very strong (large) candle that is in the same direction as the current impulse and price is close to breaking the high or low as well.
How time patterns help with corrections
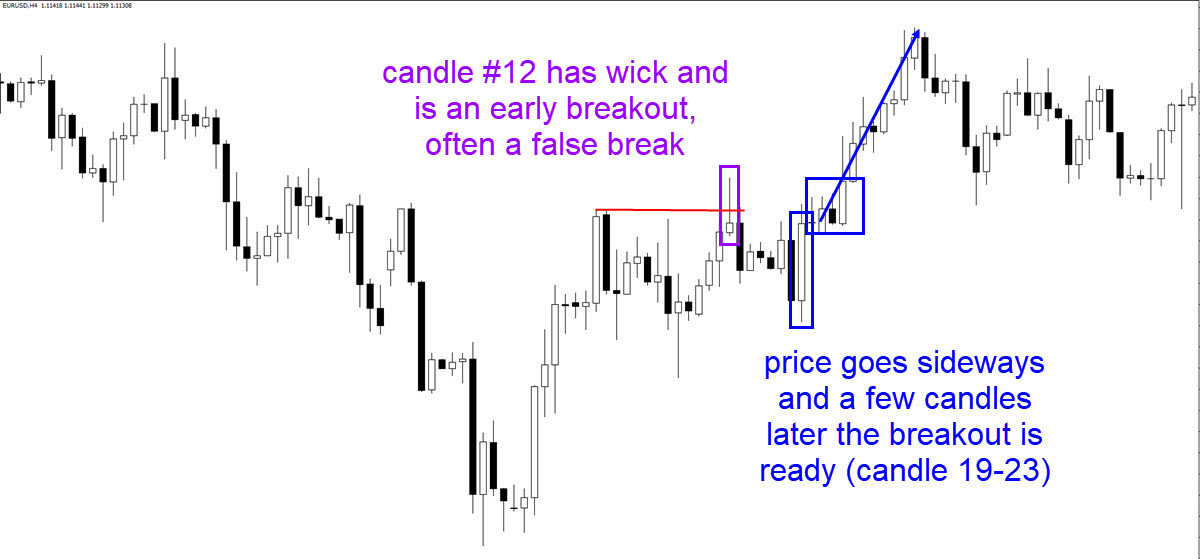
The correction patterns also tend to align themselves with time patterns. From our experience, we tend to see price continue successfully if price breaks the correction on candle number 13 or higher. The most false breakouts, also called fake-outs, occur between candle number 5-6 and 13.
Another key factor is to keep an eye on the type of price action is visible between candle number 5-6 and 13:
- Corrective price action most likely confirms the fact that price is building a chart pattern which in turn makes a continuation of the previous impulsive price action more likely.

- Impulsive price action most likely confirms the fact that price is building a deeper retracement or reversal, which in turn makes a continuation of the previous impulsive price action unlikely.
Any breakout that occurs between candle 13 and 34 is often sturdy and trustworthy. Of course, this is just a rule of thumb and exceptions are always available.
Breakouts that occur between candle number 34 and 55 are question marks and depend from case to case. Breakouts that occur above candle number 55 tend to be weaker, because in this scenario, the price is already building a larger correction on a higher time frame. Traders could think about monitoring one time frame higher after candle number 34 and especially after candle number 55.
Here is a 1 hour chart where price breaks on candle number 49. Price makes a false break and first retraces before moving up higher. Rather than trading a breakout on the same time frame, we prefer to zoom out and monitor the breakout or reversal on the higher time frame.
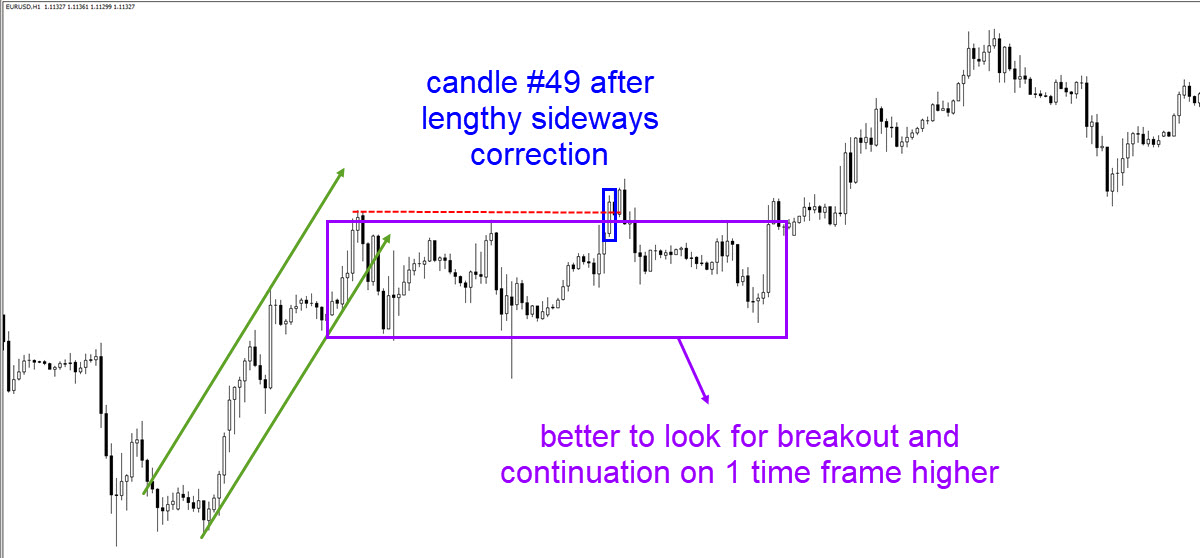
The higher time frame (see image below of 4H chart) does neatly capture the right breakout moment.
If 5-6 candles fail to break on the higher time frame, then the same situation could occur where a larger correction or reversal could take place but now on one time frame higher.
For more information, free analysis, webinars, videos, tools, systems, and methods for trading stocks, cryptos, Forex and options, please check out my website www.EliteCurrenSea.com.
Wish you good trading,
Chris Svorcik


Leave a Reply