Fractal Trading – Applying for Deeper Price Patterns on Charts

Dear Traders,
Did you know that the financial markets are fractal in nature? This means that price patterns repeat in a similar way on all scales (time frames).
The Fractal is, however, also a basic MetaTrader 4 indicator, which offers key support and resistance levels that define the price chart.
This article explains the Fractal concept, Fractal indicator, Fractal price action, and how traders can benefit from having the tool on their charts.
Use Fractals for Deeper Patterns
The fractal concept basically means that the same patterns repeat over and over again, regardless of the time scale.
Here is the definition before we move on: “fractals are never-ending patterns that are self-similar across different scales. They are created by repeating a simple process over and over in an ongoing feedback loop, very often seen in nature such as snowflakes, shells, flowers, crystals, lightening, food (broccoli).” (wikipedia)
The Fractal is also an indicator which is used to analyse the chart and determine fractal support and resistance (S&R) levels. Famous trader Bill Williams created it in the 1970s, originally for commodity daily charts. He discovered that Fractals with a value of 2 had the most importance and value because the chart was repeating itself in similar patterns based on that Fractal count.
It was a major discovery because it meant that the financial markets and charts were also fractal in their character, similar to other objects in nature.
How do you Find the Fractal on the Charts?
The Fractal is an indicator that shows repetitive patterns by spotting critical candle highs or lows. How? A Fractal candle is the candle high or low, which is the highest or lowest within a group of (usually 5) candles.
A Fractal value of two (2) indicates that a fractal will be placed on a candle high and/or low if a candle has the following characteristics:
- Resistance Fractal is the highest high of 2 candles to the left and 2 candles to the right.
- Support Fractal is the lowest low of 2 candles to the left and 2 candles to the right.
- This means that any candle which has a high or low which is the highest or lowest of a group of 5 candles (middle candle and 2 to the left and 2 to the right) will be a candle with a Fractal.
There are really no exceptions to this rule:
- The sequence of the 2 candles to the right or left are not important.
- The only aspect that matters is the middle candle versus the 2 candles to the left or right.
- Whether the 2nd most left/right candle from the middle candle is lower or higher than the 1st most left/right candle from the middle candle is irrelevant.
- The same rule is applicable for all time frames.
- A group of 5 candles is the minimum when using a Fractal indicator value of 2 but there is no maximum. If a candle high or low has 40 candles to the left and/or right of it that are lower/higher, then this is equally valid as a Fractal.
- A candle can have both a Fractal at the candle low and candle high.
A Fractal indicator with a value of three (3), for instance, will place the Fractal on candles once 3 candles to the right and to the left close lower and/or higher than that middle (Fractal) candle.
Simple said, the Fractal value simply indicates how many candles to the left and to the right you need before a Fractal candle appears.
Traders can use different Fractal values if their platform allows them to change the value. At the time of writing this article, the Fractal value used a fixed value of 2 on the MT4 (MetaTrader 4) platform, but it could be changed on some platforms to any value that a trader prefers.
What Does the Fractal Indicator Show?
The Fractal indicator can be used for:
- Finding support and resistance (S&R) levels.
- Filtering out setups that are close to a Fractal (S&R).
- Potential breakout, bounce, and reversal trades.
- Understanding the position of Fractals versus MAs and price action.
Finding S&R Levels
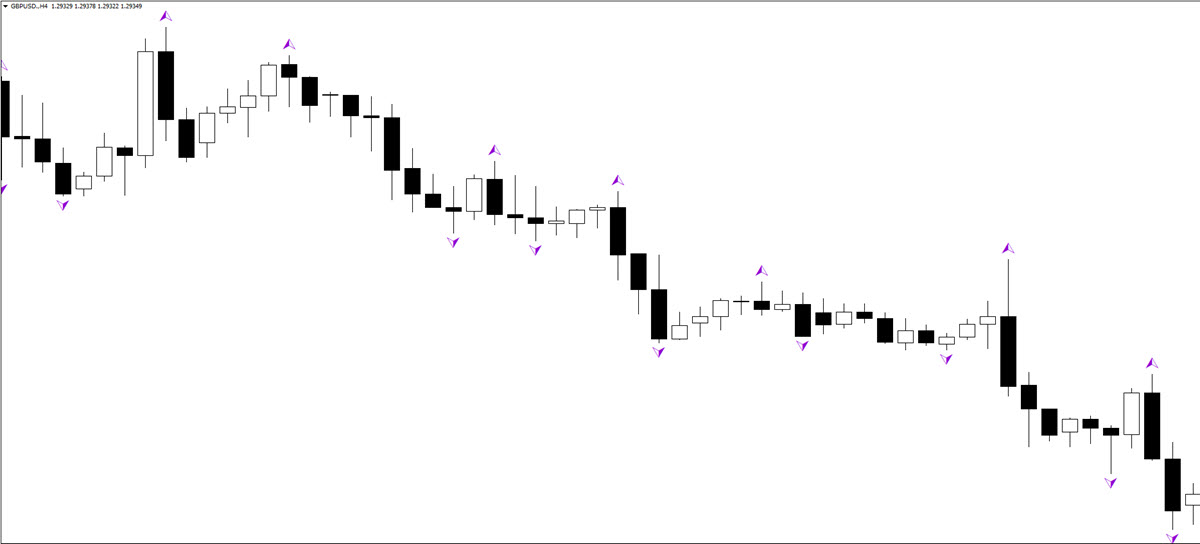
Keep in mind that the Fractal value is not equal to where the Fractal indicator is placed on the chart. The Fractal indi is always placed above the candle high and/or below the candle low for visual reasons (so traders can see it on the chart).
The actual Fractal levels, however, are the candle high or candle low. So when you see a Fractal on a candle, then the Fractal level is that candle high and/or low:
- A Fractal above the candle indicates that the Fractal level is the candle high of the candle with the Fractal.
- A Fractal below the candle indicates that the Fractal level is the candle low of the candle with the Fractal.
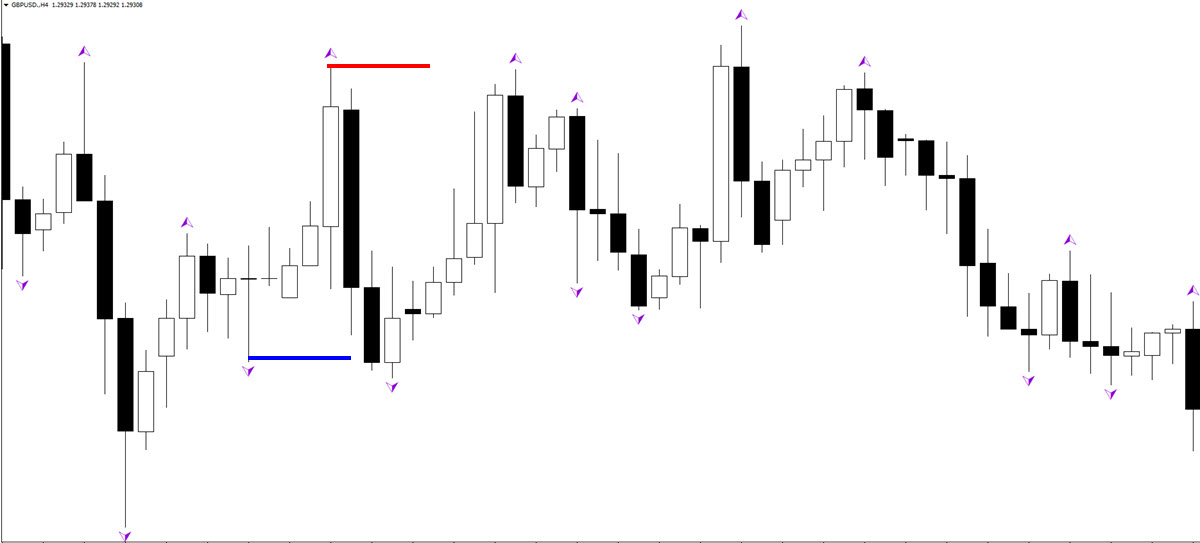
Traders can use Fractal indicators as a support and resistance level. The benefit is that traders can avoid trading into a Fractal S&R, they can trade reversals at a Fractal, or they can trade the breakouts away from Fractals. Let’s review each of these scenarios one by one.
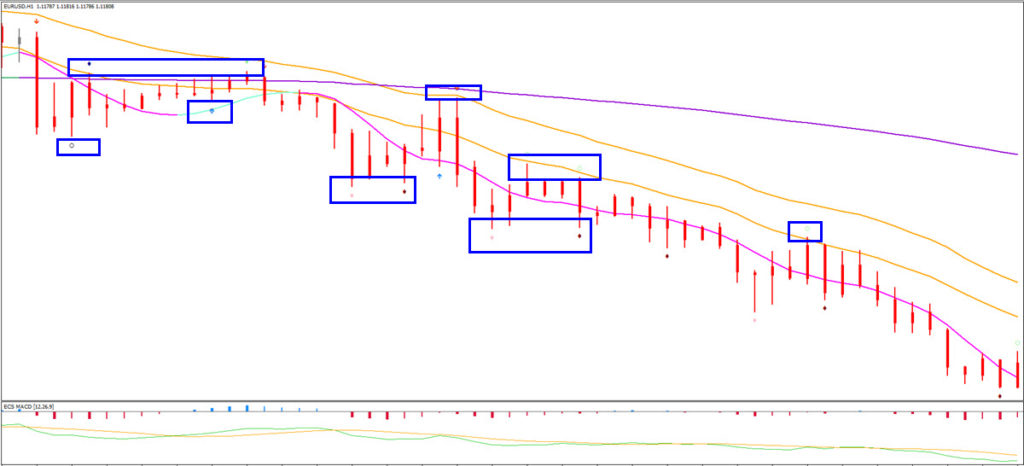
Filtering Out Setups
Filtering setups is best done on a higher time frame. If you trade on a H1 chart, then using H4 or daily charts for filtering out setups makes most sense. Generally speaking using Fractals from higher time frames such as daily, weekly, or monthly for filtering out setups is best.
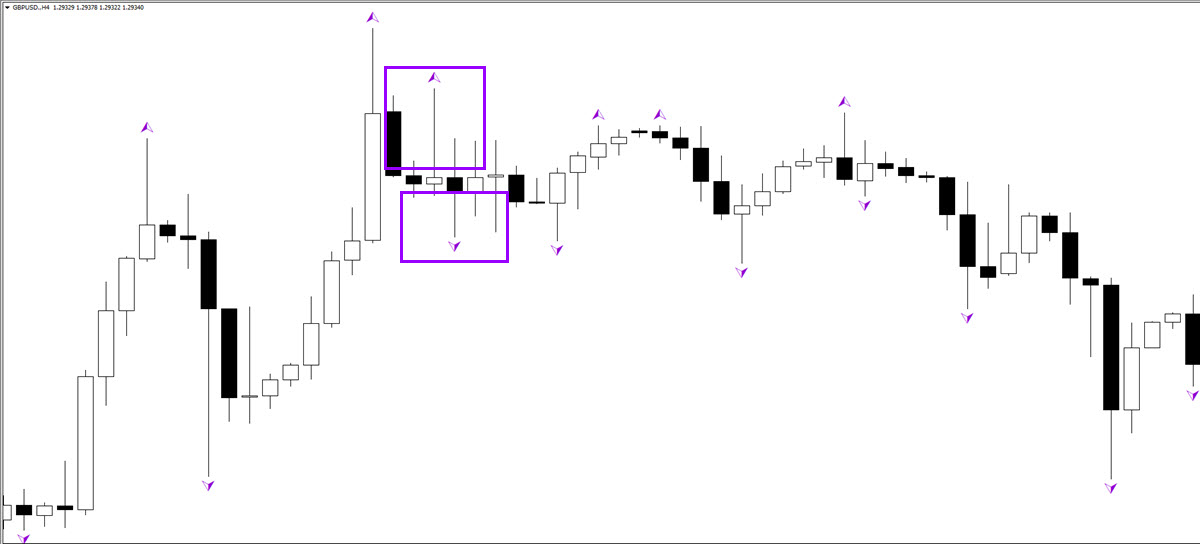
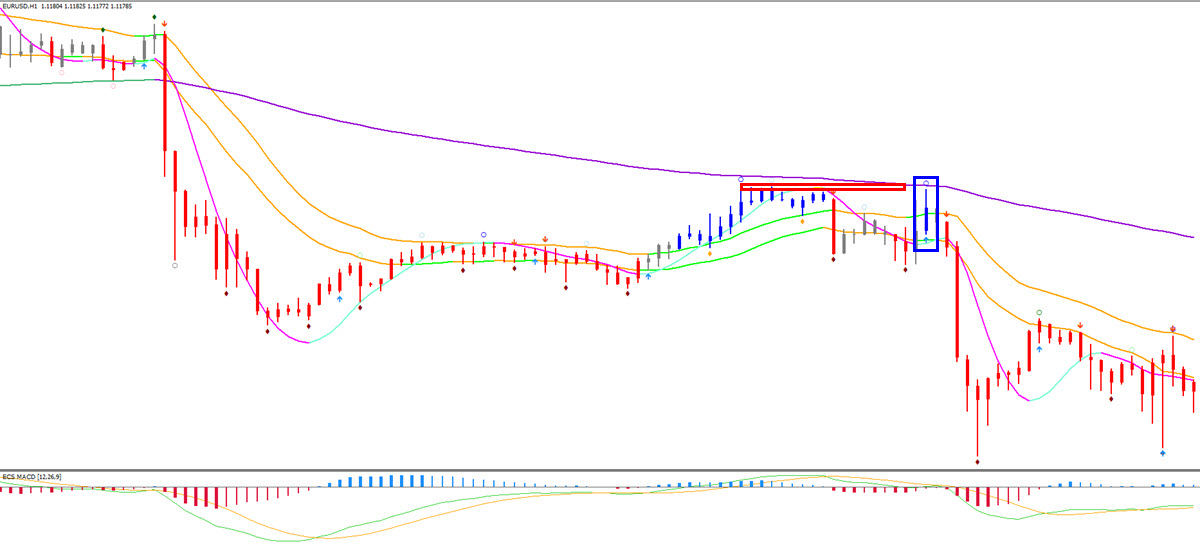
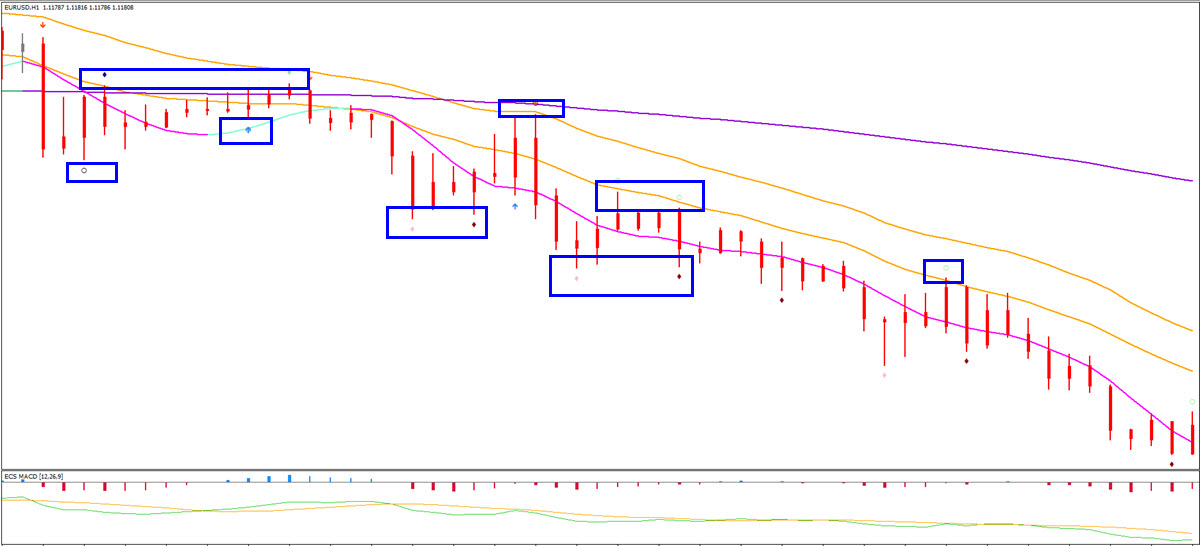
When a breakout trade setup is too close to such a S&R level, then avoiding the setup could make sense.
The image above shows how a bullish breakout is best to skip when taking into account that price is running into resistance Fractals and that the 21 ema zone and 144 ema close are bearishly aligned.
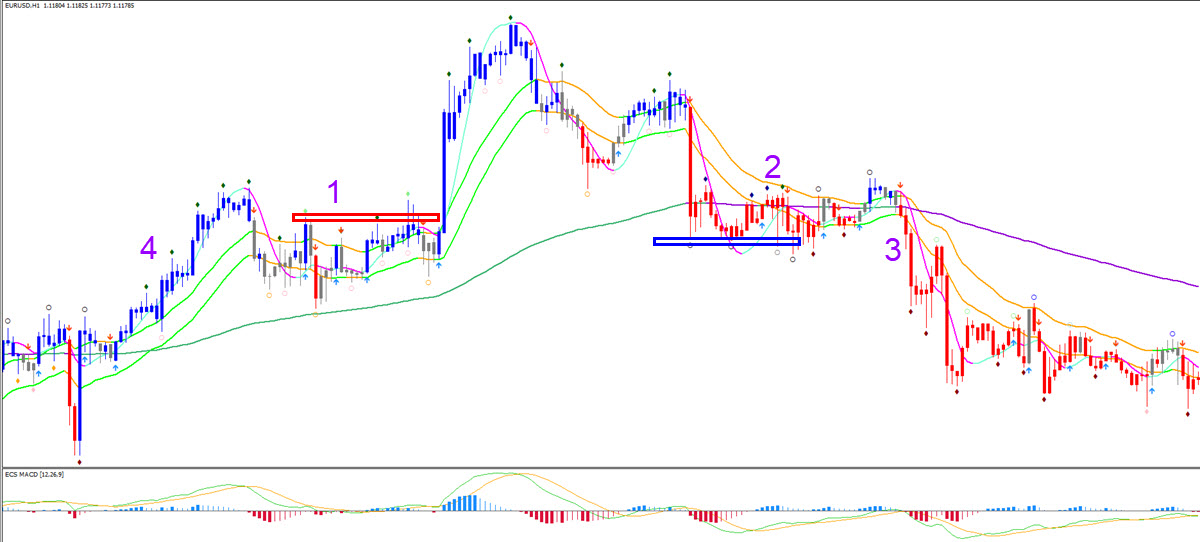
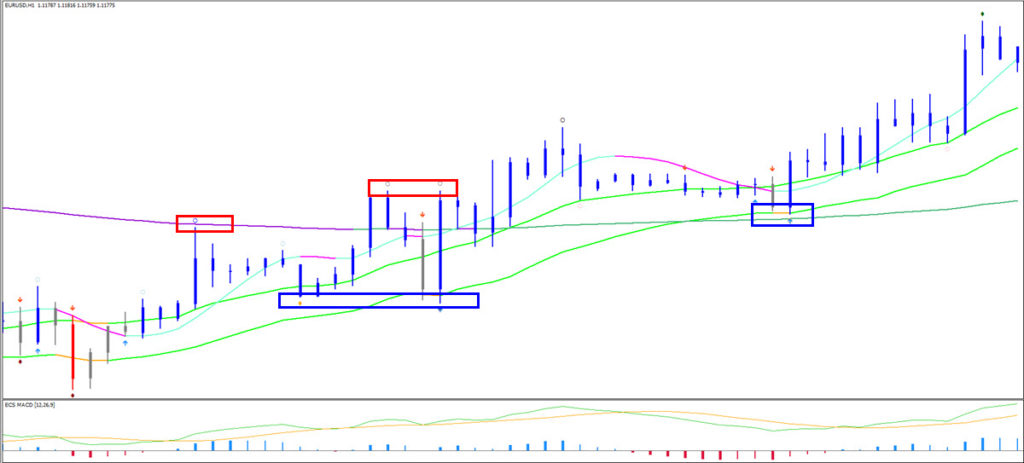
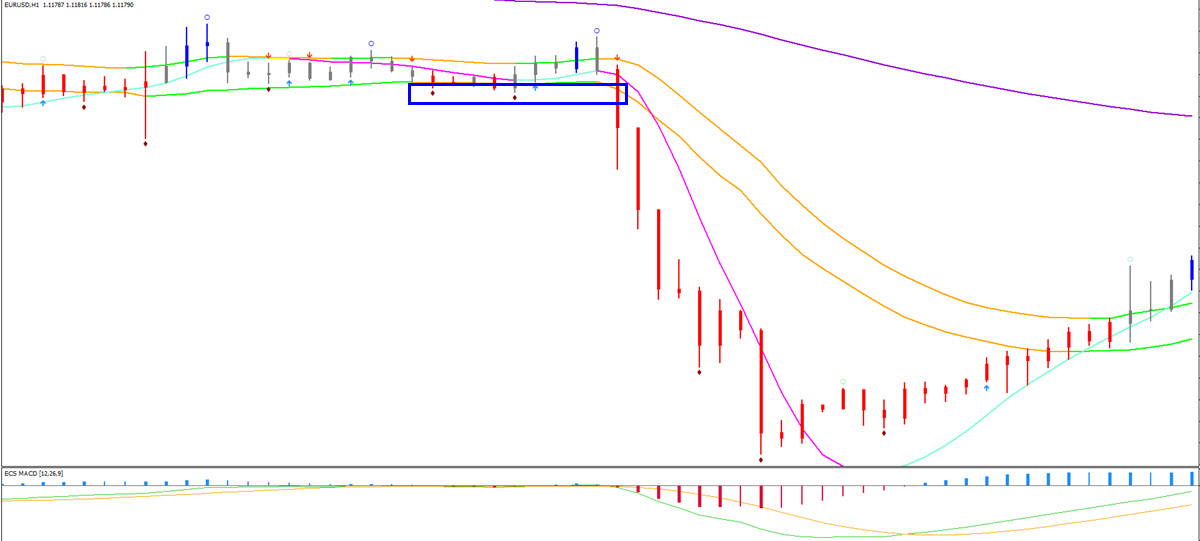
Reversal Setups
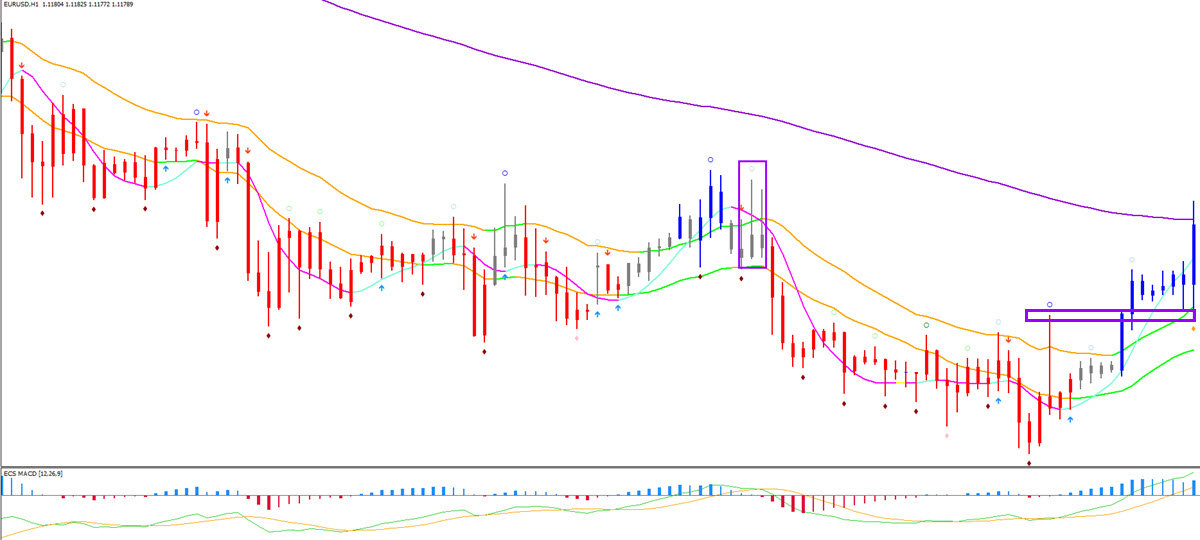
Fractals offer S&R and thus they can also be used for potential reversal setups as well. The image above shows how price breaks above a resistance fractal and 21 ema zone for a move up towards the 144 ema close.
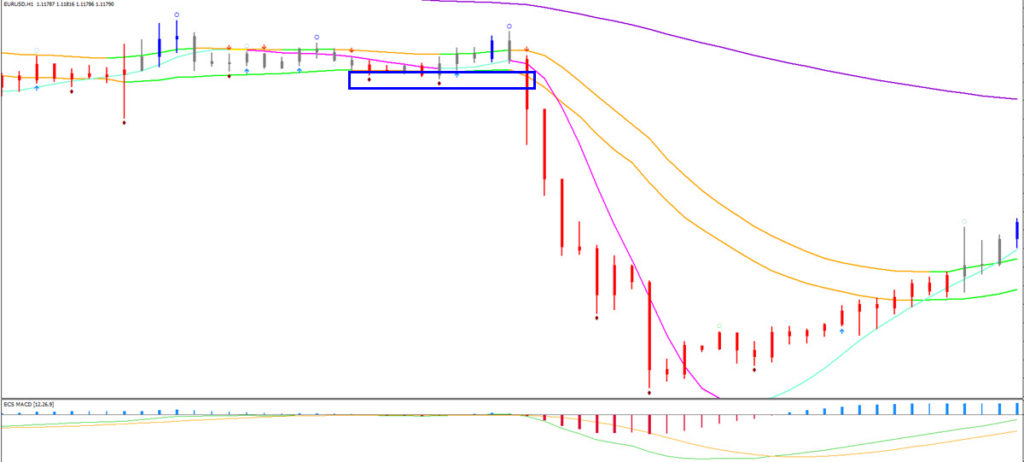
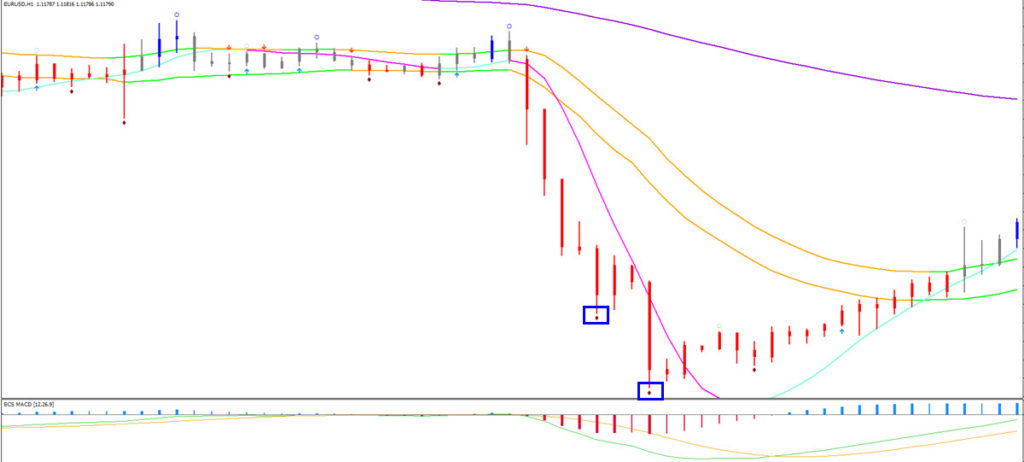
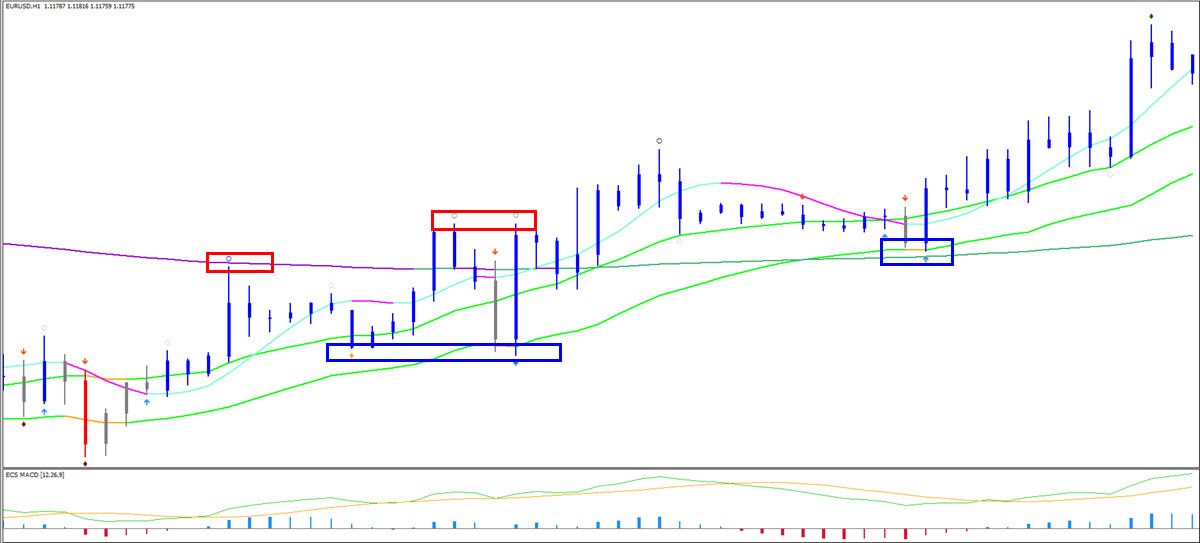
Breakout Setups
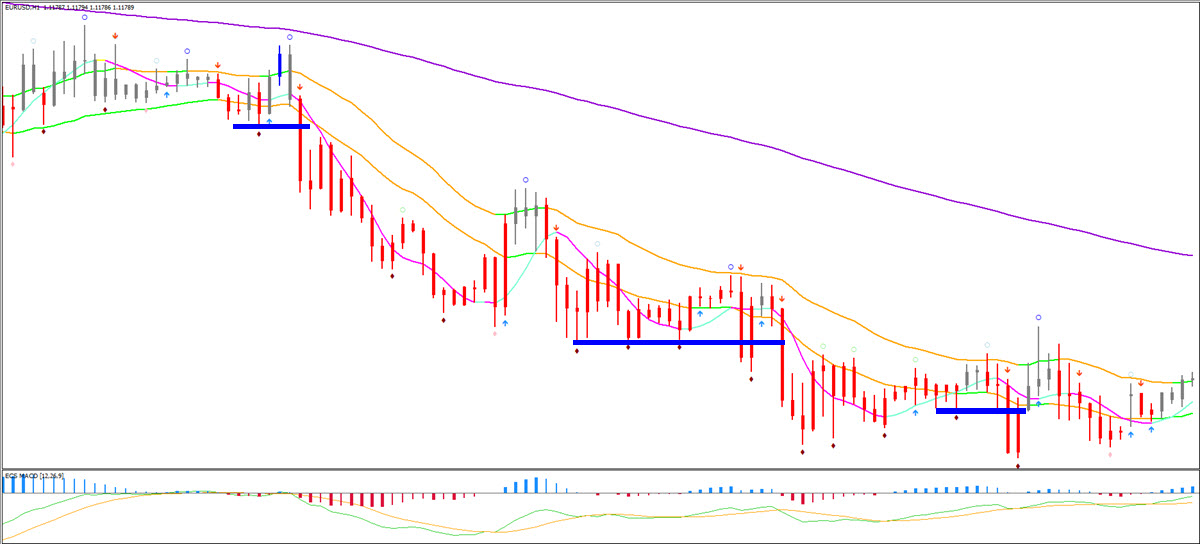
Fractals can also be used for breakout setups when price breaks or closes above/below a Fractal level. This can be done on an entry time frame. So if you trade on the H1 chart, looking for a breakout on the same time frame is OK.
Breakouts can be traded by either placing a pending order beyond the Fractal or waiting for a candle close to close above the resistance or below the support level of the Fractal. A breakout candle is also stronger if price closes near the candle high or candle low (of the breakout candle).
Fractal Position versus MAs
The Fractal indicator can be used for understanding the market structure in more depth. We already discussed how you can analyse the charts in more depth by reviewing MAs versus MAs, price versus MAs, and the angle of MAs. All of this is explained in our course called SWAT – simple wave analysis and trading.
Fractals versus MAs also provide useful information:
- The trend is even stronger if the support Fractal is above the 21 ema low in an uptrend and the resistance Fractal is below the 21 ema high in a downtrend.
- The market is offering a good breakout spot if the fractal is in or close to the 21 ema low in uptrend and in or close to the 21 ema high in downtrend.
- If the Fractal is far away from the 21 ema zone (in the opposite direction of trend), then this could be a signal that the trend is weakening.
- Fractals at the 144 ema also often indicate key bounce of break spots for trend continuation or reversal.

For more information, free analysis, webinars, videos, tools, systems, and methods for trading stocks, cryptos, Forex and options, please check out our website www.EliteCurrenSea.com.
Wish you good trading,
Chris Svorcik


Leave a Reply