Identifying the Chance of Reversals, Retracements or Trend Continuations (Trend Part 6)
Subscribe
Hi Traders,
Understanding how the trend really works is a great asset for every trader. Unfortunately, trends do not last forever… Eventually it will make a pause or even stop and turn around (reverse).
It is important to realize when a reversal could occur because you want to avoid trading with the trend at its end.
Our focus of part 6 is to explain when traders can expect a retracement within the trend or a reversal of the entire trend.

Path of least resistance
Price movement is showing the path of least resistance. The path is decided by 2 main factors: energy and resistance. Or in other words, there is a continuous battle between momentum (energy) and support and resistance (S&R).
Sometimes momentum is stronger than S&R. In other cases momentum is weaker than S&R.
- If momentum wins, then price will either continue its path with perhaps only a small interruption. The faster price is moving without showing divergence, the stronger the momentum will act.
- If S&R wins, then price will stop at S&R and revert into the other direction or go sideways. Generally speaking, the more confluence a support or resistance level has, the stronger the zone will behave.

Retracements: how far can we expect price to go?
The trend typically stops at a point when momentum becomes weaker and in an area where support and resistance (S&R) shows strong confluence. This is when the retracement or reversal often starts and price develops a motion against the direction of the trend.
The next main question is: will price only make a light pullback, a deep retracement or actually reverse in its entirety?
Divergence is an important factor in answering this question. When multiple time frames are all showing divergence, then a reversal becomes more likely. The more time frames, the more likely that a reversal is about to start. For instance, divergence on the weekly, daily and 4 hour chart would seriously endanger the chance of trend continuation and increase the chance of a trend reversal.

However, if price is not showing divergence, then it is more likely that price is making a light pullback of deep retracement before the trend continues.
Of course, anything in between no divergence or divergence on multiple charts is a grey area. Typically on a 1 hour chart or lower, single divergence will cause a light pullback and double divergence will cause a deeper retracement. On a 4 hour chart or higher any type of divergence has a higher chance of creating a deeper retracement or reversal.
Measuring the difference between retracement & reversal
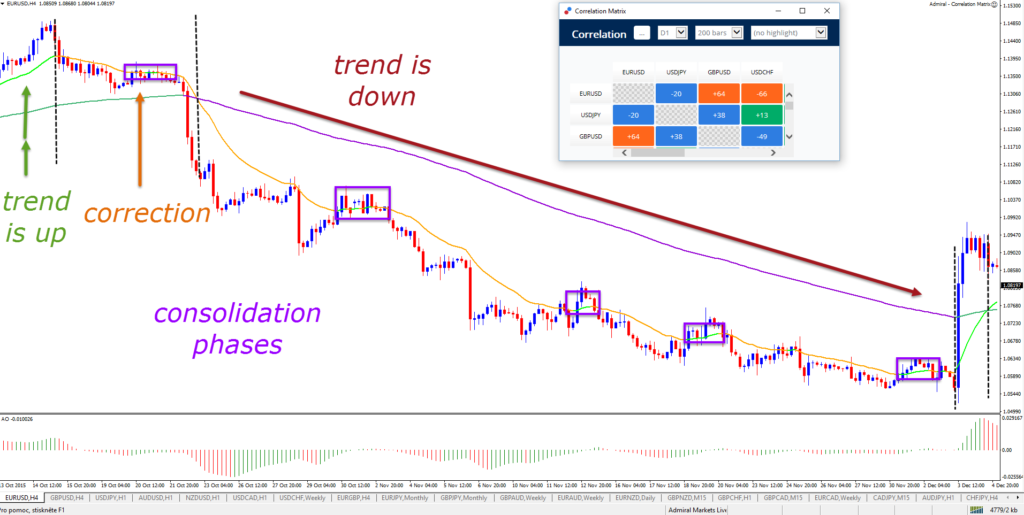
A great way to understand when the trend might continue is by monitoring the moving averages on the chart. Typically price retraces back to them before the trend continues. Besides moving averages, the Fibonacci levels and trend lines also are very useful for understanding when the trend could wrestle back control and stop the retracement.
I use the following EMA’s and classification:
- Price bounces at 8ema: momentum continuation
- Price bounces at 21 ema: shallow pullback
- Price bounces at 144 ema: deep retracement
- 21 ema crosses 144 ema: reversal
- 21 ema keeps touching/hitting 144 ema: sideways range
Before leaving, make sure to read our entire Fibonacci series!
Cheers and good trading,
Chris
WARNING: Trading on the financial markets, including Forex, is high risk. Your losses can exceed your deposits. All pages, information, articles, and content on this website is for informational and educational purposes ONLY. Read the detail terms and conditions, including risk disclaimer via this link.
Twitter: @elitecurrensea
Youtube: Elite CurrenSEA
Live webinars at: Admiral Markets
Trend series part 1 , part 2, part 3, part 4, part 5.
Before leaving, make sure to read our entire Fibonacci series!


Leave a Reply