Your Guide to Forex Volume Indicators
Understanding and utilizing volume in technical analysis is essential in trading. Volume indicators can confirm trends, chart patterns, increase predictability of breakouts and more.
When trading stocks, you get a clear picture on rise and fall in volume as Stock Exchanges provide transparent information. In the world of Forex, things are not so simple.
Forex market is decentralized. Thus, it’s not possible to count all of the contacts and their sizes in a similar manner to the stock market. Consequently, Forex traders are using indicators based on tick volume.
A tick represents a change or movement in the quote in any direction. Trading platforms measure the number of ticks during a given time frame. Therefore, it’s possible to see the market activity rise and fall without weighting the number of actual transactions. Rise in volume indicates that new traders are joining the market. Liquidity increases and assets get the necessary energy to start moving.
In this guide, we’ll talk about the 4 most important Forex volume indicators that are widely used by professional traders when conducting a technical analysis:
- Volumes Indicator
- On Balance Volume (OBV)
- Money Flow Index (MFI)
- Accumulation and distribution.
The importance of Volume in trading
Integrating volume in your technical analysis can greatly improve your results. Volume increase increases pressure on the market. Consequently liquidity is higher. There are more participants placing orders and closing positions at the same time. As a result, spreads are tighter. Spread is the difference between the bid and the ask price. Generally spreads on major and minor Forex pairs are tight but some of the exotic ones come with crazy spreads.
Volume and liquidity is generally low before important announcements. Sudden increase in volume can be followed by sharp market moves.
Many traders solely use chart patterns, support and resistance levels for spotting the trading opportunities and volume indicators for entries and exits.
Let’s say you’re in a trend and a volume indicator stops supporting the trend by displaying decrease in volume, this might be a signal to either close the position or use a trailing stop before reversal happens.
High volume is an energy that can complete chart patterns, break resistance and support points and continue trends. On the opposite end, drop in volume can indicate that there is no energy for breaching significant resistance levels or trend continuations.
Volume Indicator
In Forex, the Volume indicator measures the number of price fluctuations within each period of the selected time frame.
The indicator consists of 2 color bars. The red bar means that the volume of the bar is lower than the volume of the previous bar. The green color means that the volume of the bar is bigger than that of the previous bar.
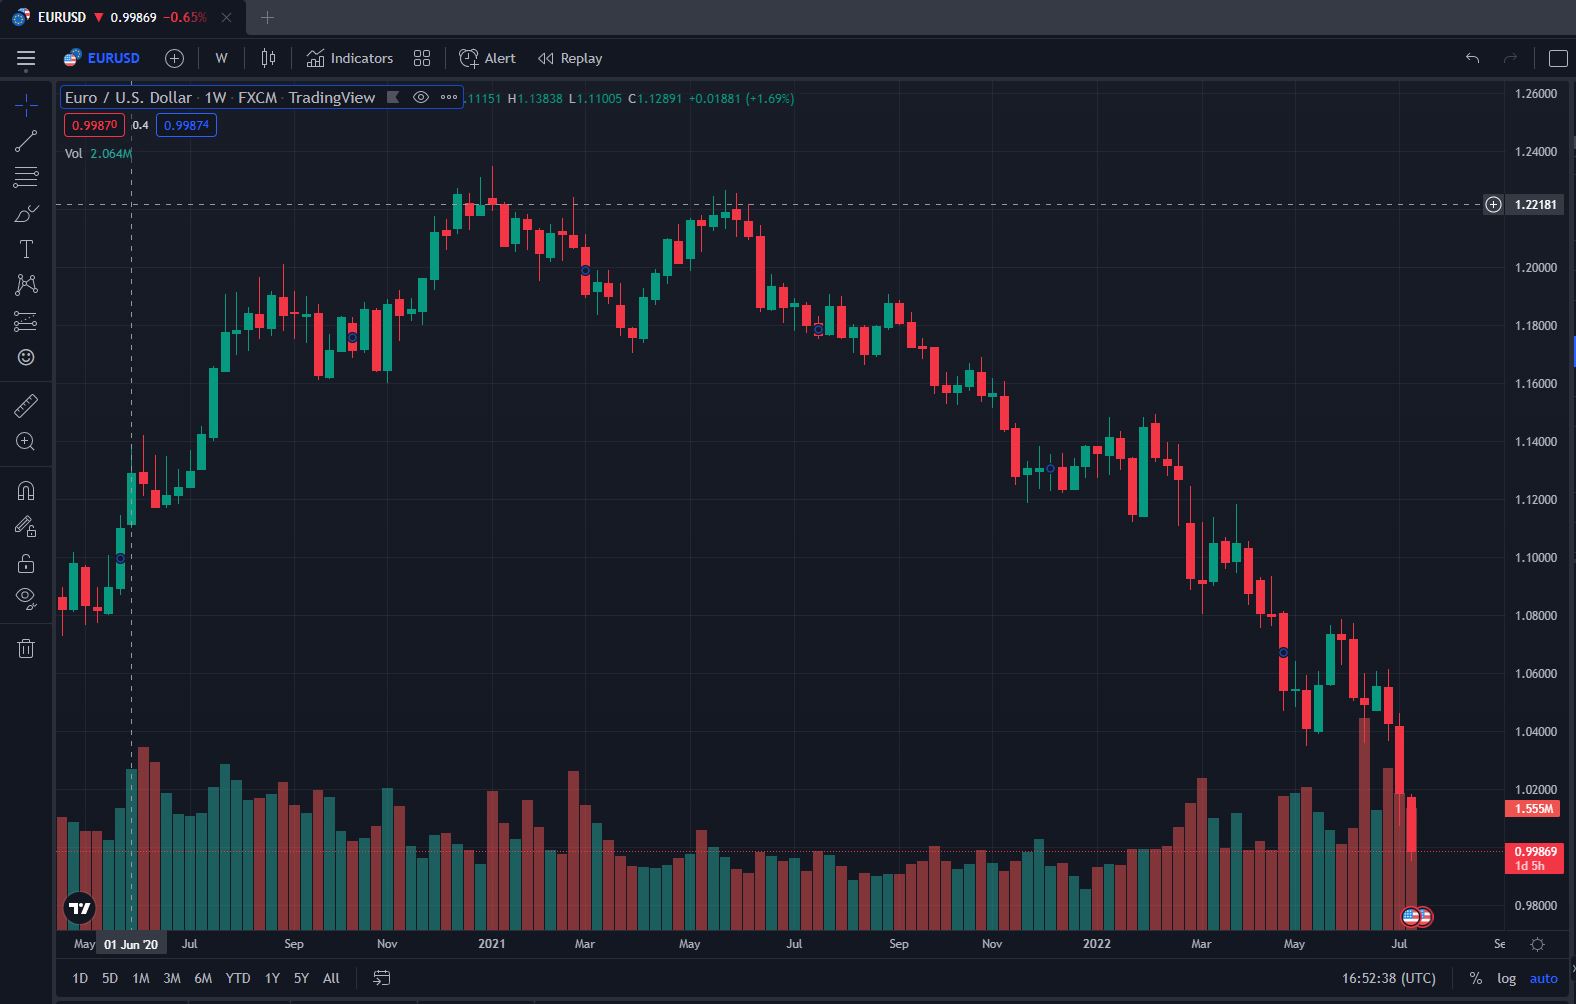
The indicator reveals how much strength is behind the trend. In case the trend is in a bull market for a long time and Volume decreases gradually, this might indicate that the bulls are losing steam and the trend will reverse. A rising trend should be accompanied by rising volume to provide a trend joining signal. The same type of thinking works for a downtrend.
On-Balance Volume Indicator (OBV)
On-Balance Volume indicator can be seen as the single blue line as it’s shown in the example. The indicator moves between negative and positive values. On-balance has a positive value in case the recent price is higher than the previous closing price and vice versa. 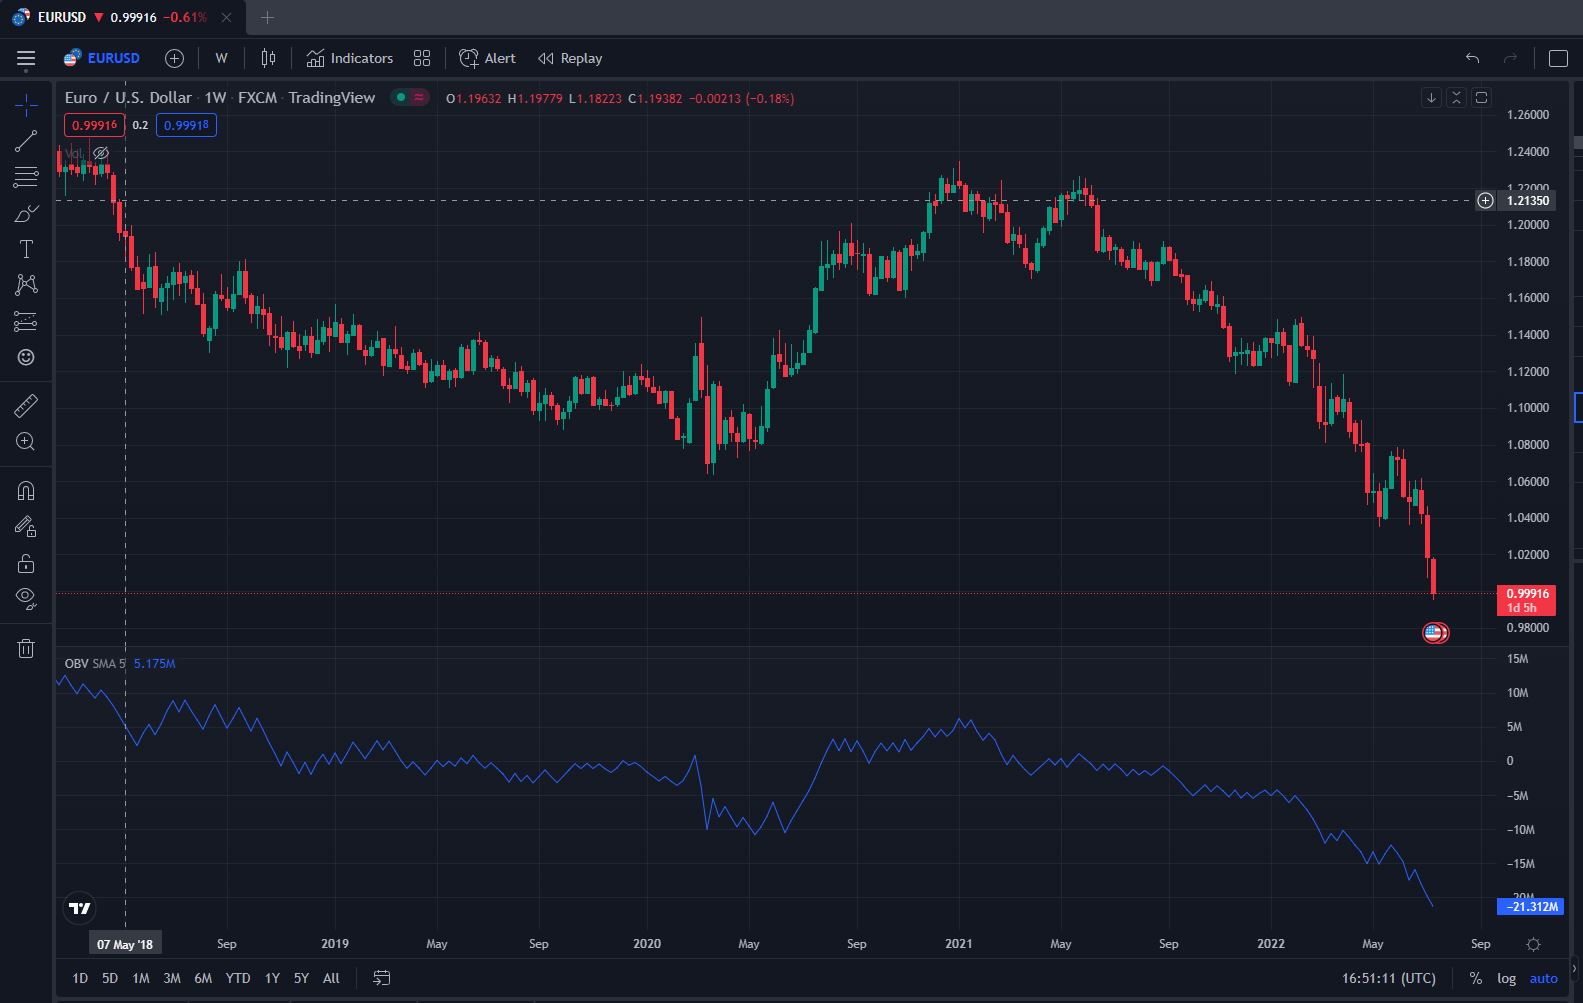
The indicator is mainly used as a tool for trend confirmation and trading divergences between the prices.
- Bullish Divergence – occurs when the price action decreases and the blue line increases simultaneously, traders can anticipate an upward movement.
- Bearish Divergence – occurs when the price keeps rising while the blue OBV indicator line declines.
- Trend Confirmation – happens when the trend and the OBV indicator are moving towards the same direction. This means the increase in volume supports the trend and it’s likely that the trend will continue.
In addition, OBV line can indicate a potential breakout. When the market is in a range, you should keep an eye on the indicator as its increase can predict the potential upward breakout and vice versa.
Cons of OBV indicator
Keep in mind that the indicator doesn’t incorporate all the vital data and it’s best to use OBV in context. In addition, the OBV doesn’t provide reliable signals on shorter time frames. In general, short time frames are known to be noisier. Meaning, the market can make a lot of unpredictable moves. Usually volume decreases before big announcements such as: interest rate decisions, Consumer Price Index, unemployment data, etc. And as the news comes out, traders start placing orders and volume increases. Reactions on news can be unpredictable for technical indicators due the fact that news belongs to the realm of fundamental analysis.
Money Flow Index (MFI)
The Money Flow Index Indicator looks very similar to a Stochastic oscillator. The main characteristic of the indicator is that it incorporates volume. MFI produces 2 main signals:
- Overbought and oversold condition
- Divergence
Whenever the Money Flow Index crosses the 80 level up, traders start anticipating that the price is in pick. The opposite is true for level 20. In this manner, MFI acts like the overbought and oversold indicator.
If the trend is bullish and the MFI line is bearish, this might be an indication of reversal. Trends need energy to keep growing. And volume indicators display that energy. This is why it’s important to take the volume indicators seriously.
If the trend is bearish and while the MFI indicator keeps getting lower, that indicates that the bears are running out of power and bulls might take over. 
Accumulation and distribution indicator
Accumulation and distribution indicator or ADI is a technical indicator that integrates volume as weighting coefficient in the price change. The indicator is very similar to the On-Balance volume indicator in terms of functionality. The indicator is widely used in various asset trading. As the name suggests, it displays when the asset is being accumulated or distributed.
When the indicator drops, it means that selling is taking place. When the indicator increases, buyers are taking the initiative. ADI is a momentum indicator and traders use it to predict the trend reversals. Divergence between the price direction and indicator can predict the reversal. 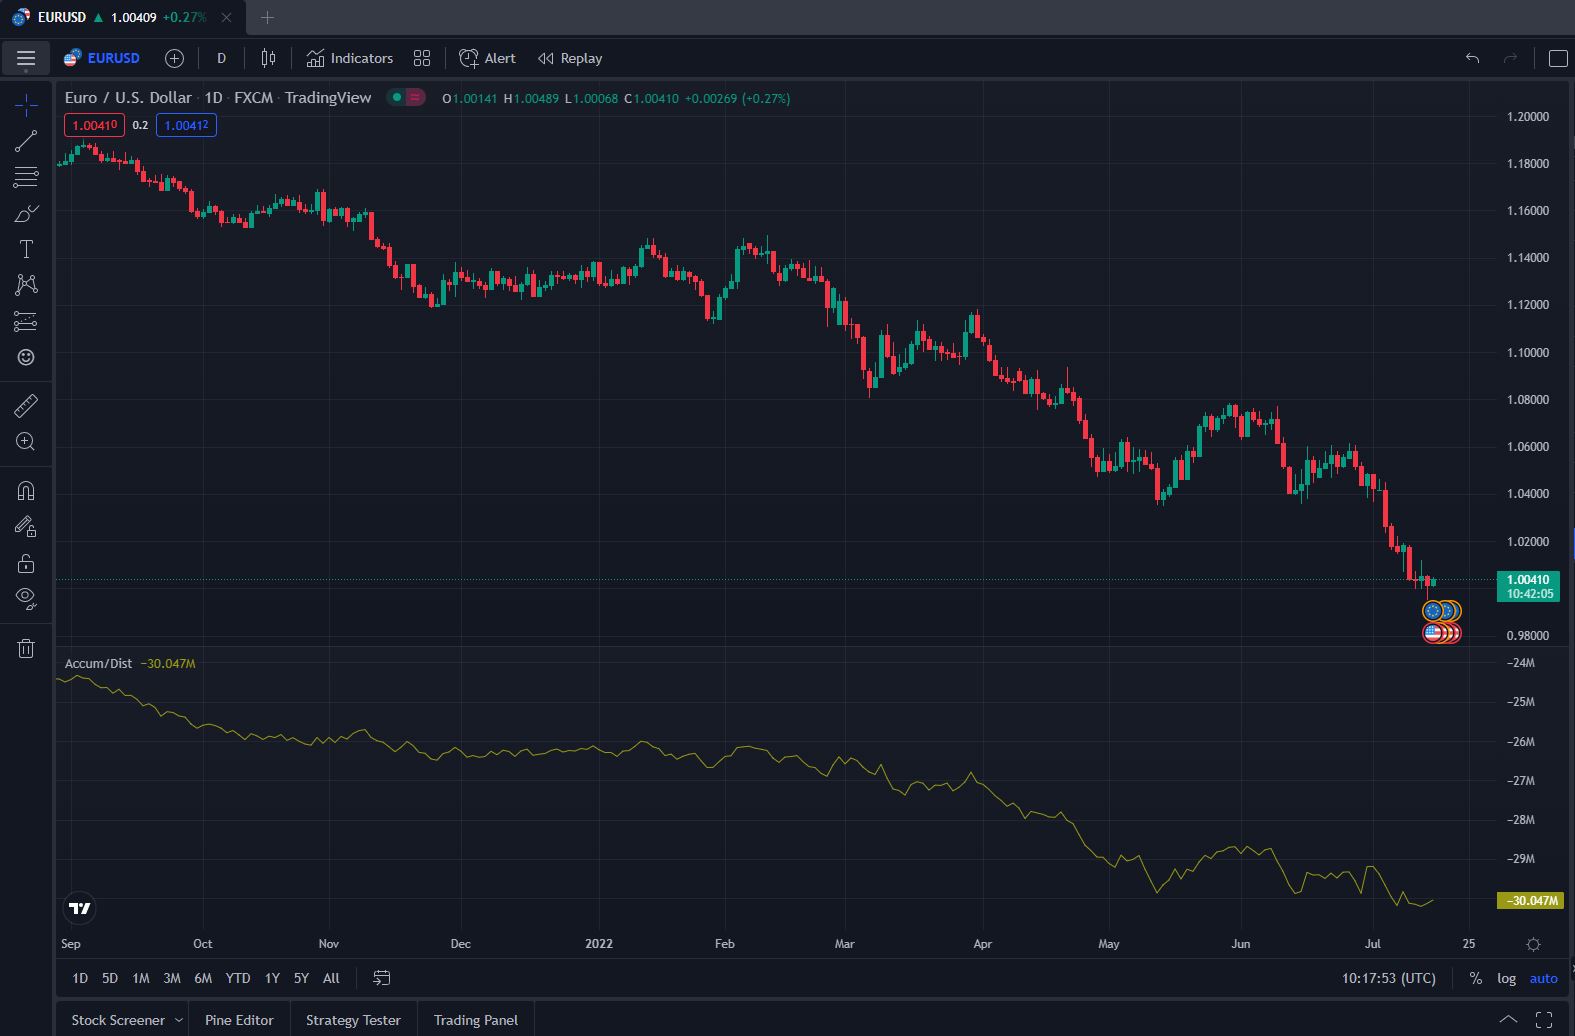
Pros and cons of volume indicators
Now it’s time to talk about some of the limitations of volume indicators. The biggest limitation is that the indicator is just a technical tool. It shows what happens but doesn’t give you the answer to what motivates traders when they increase their sizes or join the game. In many cases motivation comes from fundamental reasons. Fundamentals such as: economic policies, political situations, global processes and more are giving direction to the markets. But the trades are done using technical tools.
In some cases, volume increase has nothing to do with fundamentals. Traders just spot a nice pattern laying there and start joining the game to profit. For this reason, patterns become self fulfilling prophecies.
Volume indicators are just one useful layer in technical analysis. Professional traders have well defined rules to why they open certain trades. Adding too many layers to the rules can cause analysis paralysis. For instance, when you see a nice chart pattern and the pattern gives you a buy signal, while volume indicator gives a sell signal and fundamentals tell you to wait for the FED decision. Analysis paralysis occurs when your rules contradict each other and you become unable to open a trade.
Volume indicators, (technical indicators and chart patterns in general) produce many false signals on shorter time frames. The reason for this is simple: market noise. Trading is a multi timeframe activity. Position traders base their decisions on larger timeframes and place fewer orders. Scalpers and high frequency traders place much more orders daily and use smaller time frames, as a result, smaller time frames charts are characterized by more unpredictable changes in price.
FAQs on Forex volume indicators
How important is volume in trading Forex?
Taking into consideration volume when placing orders is vitally important due to the fact that increase and decrease in volume can indicate the level of interest in a certain product. The higher the interest in a trend, the greater the chance of its continuation and vice versa.
What can volume indicators signal in trading?
Volume indicators can confirm a trend or chart pattern, signal reversal, predict breakout, etc. Volume indicators show the interest in any given asset. However, it’s important to note that Volume indicators work differently in stock and Forex markets due to the fact that Forex is a decentralized market.
What are shortcomings of volume indicators?
Volume indicators do not incorporate all of the vital data such as fundamentals in their signals. Therefore, it’s best to use volume information in a context. What’s more, the indicators tend to give lots of misleading signals on shorter time frames due to market noise.


Leave a Reply