Learn How To Understand the Deeper Nature of the Financial Markets


Dear Traders,
Did you ever wonder why price moves up and down in waves and patterns?
The Chaos Theory shows traders how they can understand and predict price movements by analysing the chart itself and its price patterns, fractals, price repetition (trend, S&R), and wave patterns.
This article explains why charts are Fractal and adhere to the Chaos Theory, why trading will always remain a probability, and why patterns sometimes fail. Take a look at our guide for a deeper understanding of the financial markets.
Here’s Why Charts Are Fractal
The market price moves up and down in waves and patterns, which is visible for everyone who has seen a chart. Interestingly, the price movements are similar regardless of the time frame.
A trader who is looking at a large time scale will see the same price movements and patterns on a lower time frame.
Let’s try a little experience: can you guess the time frames of the two images below (without looking at the answers)? 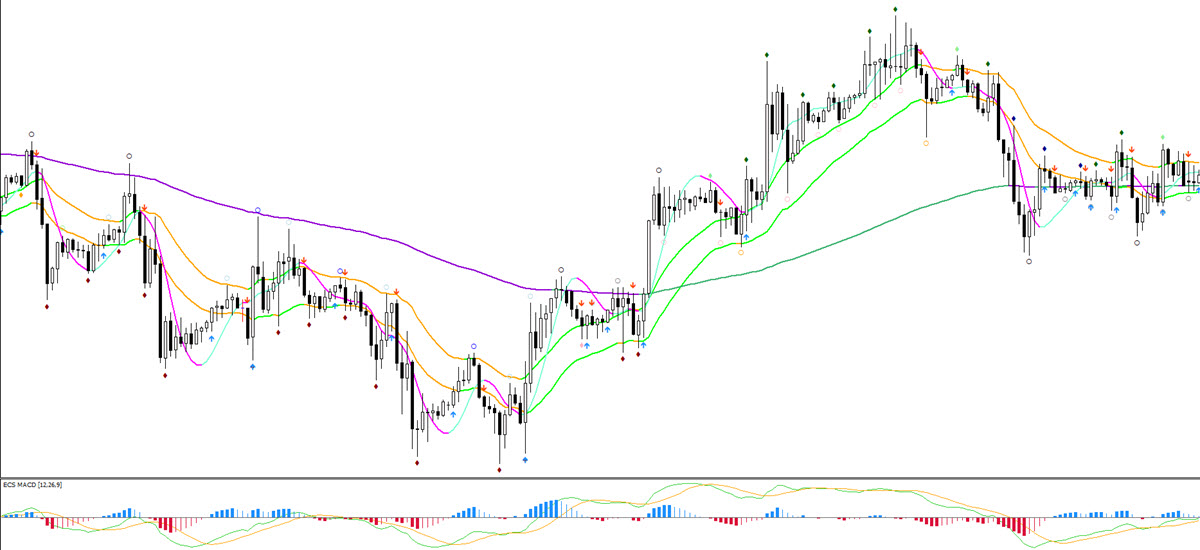
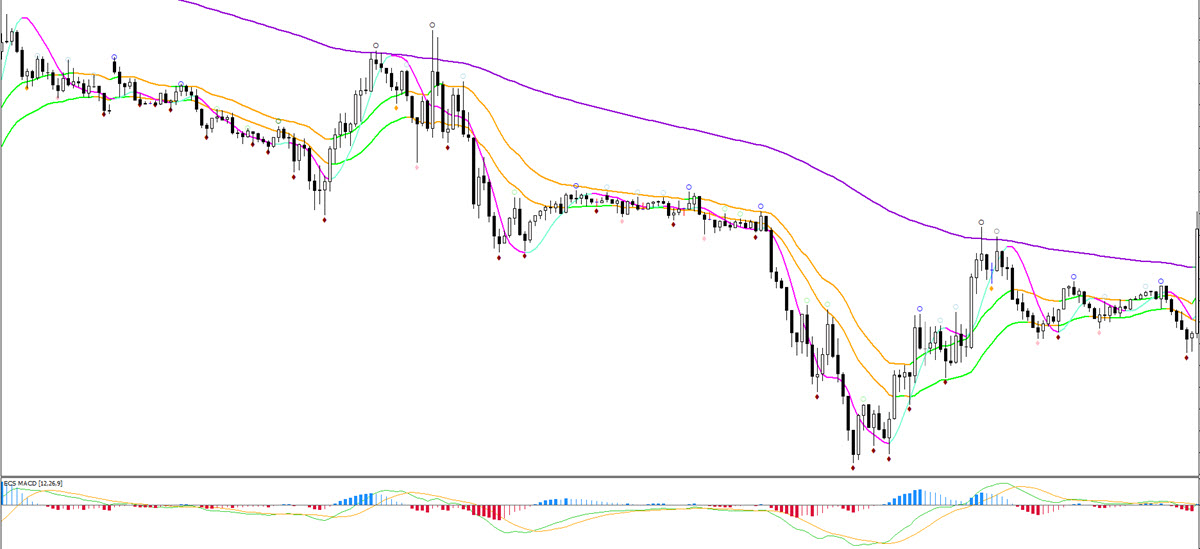
The time frames are a 1 hour chart (1st) and a 15 minute chart (2nd). Perhaps you guessed the answers correctly, but in any case, I believe that my point is clear: readers can see that both images look very similar.
Patterns that repeat in a similar way on all scales are called fractals.
The fractal nature of financial markets is in many ways similar to the fractals found in music notes, sea coast lines, and nature such as snowflakes, shells, flowers, crystals, lightening, andfood (broccoli).
So what do music notes, snowflakes, the sea coast and the charts have in common?
They are all fractal in nature.
Fractal and Chaos Theory
All of these Fractal shapes might appear chaotic and random but they are actually more organized than we expect, at least that is what the “Chaos Theory” explains.
Both Fractals and Chaos Theory concepts are a branch of mathematics which focuses on the behavior of dynamical systems that are highly sensitive to initial conditions.
The name Chaos might make you think these objects, such as weather and financial markets are chaotic but ironically, it is the exact opposite.
Chaos Theory indicates that within apparent randomness of chaotic complex systems, there are actually:
- Underlying patterns: movements that behave in a similar way.
- Constant feedback loops: an action reinforces a certain direction.
- Repetition: repetitive movements.
- Fractals: same movements on all scales (a curve or geometric figure, each part of which has the same statistical character as the whole).
- Self-organisation: spontaneous process where some form of overall order arises from local interactions between parts of an initially disordered system.
The “butterfly effect” describes how a small change (in a deterministic nonlinear system) can result in large differences to a later state. The most known example is how a butterfly flapping its wings in the Amazon can supposedly cause a rainstorm in Texas.
Chaos behavior exists in many natural systems, such as weather and man made ones such as road traffic.
Price Charts Subscribe to Fractal and Chaos Theory
This might sound complicated so let’s focus on trading.
Chaos Theory is an equally relevant theory for financial markets and price action, because in our opinion, they also show underlying patterns, constant feedback loops, repetition, fractals, and self-organisation.
This means that charts behave in accordance with the characteristics of chaos theory (these 5 aspects define Chaos Theory). Let’s review all 5 aspects of the Chaos Theory in relationship to price:
- Underlying patterns: the charts have a wide range of price patterns, such as divergence patterns, chart patterns, time patterns, wave patterns, candlestick patterns.
- Constant feedback loops: buyers and sellers are creating loops of feedback (concepts such as chart patterns, impulse and range).
- Repetition: the market movement, price patterns, and support and resistance levels are used and repeated over and over again.
- Fractals: price action moves in the same way on various and multiple time frames and markets.
- Self-organisation: time frames impact each other. Lower time frames provide information about the movement on higher time frames (5 waves on a lower time frame indicate an impulsive wave on a higher time frame) and higher time frames about what can be expected on lower time frames.
Patterns repeat (fractals) and allow us to look deeper at the true market structure, which is not as random as it might seem (chaos theory). The financial markets are just not (as) well understood without these concepts.
Traders can understand the markets better by using the 5 concepts of Chaos Theory: the price movements occur on all time frames (fractal), repeat themselves (history repeats itself), self organise, impact higher and lower time frames (self-organisation), create feedback loops (of buyers and sellers), and are full of underlying patterns (chart patterns etc).
To us, it makes sense to analyse the chart and price patterns via the primism of Fractals and Chaos Theory. The definition of a complex system works extremely well for explaining the nature of the financial markets and the corresponding price charts.
Improving Analysis and Trading via Chaos
The Chaos Theory teaches traders that they can understand the underlying price movements by analysing the chart itself with its price patterns, fractals, price repetition (trend, S&R), wave patterns, and chart patterns. In our view, traders are able to understand, analyse, and forecast better by analysing these patterns (based on the theories of Fractal and Chaos).
This is why understanding the price movements in finding the best trade setups. Patterns are important from both a practical and theoretical point of view:
- Practical for understanding the path of least resistance.
- Theoretical because they fit within the theories of Chaos and Fractals.
By using price patterns, chart patterns, trend, momentum, S&R, and price action, we can understand the path of least resistance and understand where the decision zones are located, which in turn allows us to confirm or invalidate the development of patterns and analysis, to enter trade setups if desired, and apply trade management if needed.
Indicators and tools help us determine the path and decision zones and locate setups and exits that provide us a long-term advantage. We use indicators and tools such as swat.FRACTALS, moving averages, ecs.WIZZ, Fibonacci, swat.CANDLES, candlestick patterns, chart patterns, etc to analyse the charts, find decision zones, determine trade direction, setup triggers, find entries, and manage trades. All of this is explained in our course called SWAT – simple wave analysis and trading.
Here is an overview of the tools that can be used per category.
- Underlying patterns: divergence patterns, chart patterns, time patterns, waves pattern, and candlestick patterns.
- Constant feedback loops: concept of trend / momentum /range, moving averages, ecs.WIZZ, swat.CANDLES, swat.ARROWS.
- Repetition: support and resistance, Fibonacci, moving averages.
- Fractals: swat.FRACTAL indicator, multiple time frames.
- Self-organisation: wave patterns, multiple time frames.
We think that some extra information on feedback loops makes sense. The first type is the positive feedback loop. For example when the US Dollar is showing positive economic statistics or news, it often causes the USD to go up. When the price in fact does go up, then investors/traders believe that the news is having a positive effect on the price, which could cause it to go up even more. Basically, this causes positive news regarding the price which causes the price to go up.
A negative feedback loop is two negatively correlated variables. When one goes up, then the other goes down. Traders might expect good news but the actual news is not as good as expected.
These are of course just short-term examples. The same however is valid for long-term economic fundamentals of a country and its currency and technical analysis too.
Both feedback loops occur regularly. The positive feedback loop creates trends and one directional price movements. A negative feedback creates a range and sideways price action.
Positive: price rises → traders buy → prices rise → traders buy
Negative: price rises → traders sell → price falls → traders buy
Patterns Remain a Probability
Whether price patterns play out within the expected path of least resistance always remains a probability and is never a guarantee. Some price patterns will play out as expected and confirm the expected path of least resistance whereas other patterns become invalidated and fail.
Price patterns and price movements can always confirm or fail compared to the expected pattern and compared to how we analysed the charts. There is no way that traders can ever be 100% sure about the development of a particular pattern or trade setup. Simply said, the markets remain vulnerable to changes.
You might be wondering how come nothing is certain in the financial markets and if nothing is certain, how can you forecast anything. Forecasting is not about being right or wrong about one isolated event. Everyone can be lucky at one occasion.
In many ways, forecasting the weather is in my eyes similar to trading the markets. Meteorologists are nowadays very skillful in forecasting the weather patterns in the upcoming 7 days (short-term). Studies show that their forecasts are very accurate, as mentioned in the book “Superforecasting” by Dan Gardner and Philip E. Tetlock. For instance, when there is a 30% chance of rain, then 3 out of 10 days do indeed have rain and 7 do not. The accuracy is just as accurate for all forecasts across the spectrum with the exception of low probable events between +/- 0 and 10%. The reason for the slight inaccuracy with low probable events is that the weathermen are actually correcting for our human bias because humans tend to regard a probability of 0-10% as “impossible”.
The Forex market is similar to the weather because traders also can calculate the probability of their strategy working out in the long run. Each strategy will have a historical win rate of 70%, for instance. This will vary of course from strategy to strategy. Although traders know that historically speaking they will usually win 7 out of 10 trades, there is no way for them to know when the winning setup will occur. It is impossible to find out whether the next trade will be a win or a loss.
The weather and Forex strategies work in the same way. A 70% chance means that 7 out of 10 days will be raining and 7 out of 10 trades will be winners, but we just don’t know when that will happen. Will that be today or this trade or rather the next?
Not being able to predict one particular outcome with 100% certainty does not block the ability to perform accurate forecasting:
- Weather: 70% chance of rain means that on +/- 70 out of 100 days, there will be rain and on +/- 30 days there will be no rain.
- Trading: 70% win chance with a strategy means that, as long as we trade each setup with the same approach, traders will win +/- 70 out of 100 setups.
Conclusion: in the areas of trading and weather, the next isolated event can never be predicted but the probability of particular situations (70% rain chance i.e.) can be forecasted with precision when analysing the long-term.
Which situations qualify? The accuracy of forecasting weather dramatically drops after 7 days. Weather forecasts beyond those 7 days are inaccurate and in fact, using the average climate data of the year provides a more accurate estimate. In weather the accuracy of forecasting is limited to 7 days.
In trading I think that a similar number (7) works pretty well too. In any case, the general idea and concept does apply well to the price charts. The accuracy of technical analysis is more precise in the short-term than in the long-term. Why? The further away we try to analyse from the current candle, the more difficult it becomes because there are more factors that can change the path of least resistance. New information continuously changes the most likely path of least resistance. A trader who is looking further into the future will have to deal with more variables and unknown factors, which can change the path of price and its expected path of least resistance.
What is short-term and long-term in trading? I like to use the same figure (7) as in weather but for counting candles. So anything up to 7 candles is short-term and easier to forecast than looking beyond 7 candles. This means that what qualifies as short-term is dependent on the time frame too. A daily chart indicates that anything up to 7 days is short-term (7 weeks on weekly chart, 7 hours on hourly chart, and 105 minutes on 15 minute chart).
This is one of the reasons why the SWAT method uses time patterns and Fractals that have values quite close to 7. Our swat.FRACTALS and time patterns are based on 5-6 candles. We also use similar numbers for our trade management ideas (be patient with the trade at the beginning during phase 1).
Generally speaking, traders can use these fractals, patterns, and tools to evaluate which trades have an edge in the short-run. And if they repeat those setups again and again, they can check whether similar setups show long-term consistency and profitability.
Many trades do not necessarily close in the short-term (within 7 candles), which is why we are in favor of using active trade management based on the new information available at the right time (not too soon, not too late).
It is important that traders keep in mind that the long-term results are more important than the performance of any single setup. Traders need at least 40-50 trade setups before they can make any judgment about any strategy or entry method. Anything less then 40-50 setups is just too random.
Traders therefore must keep two goals clearly in sight:
- PROBABILITY:
- See trading through the lens of probability.
- Nothing is certain.
- Keep trading the same way, unless your long-term results are questionable.
- TRADING PSYCHOLOGY:
- Manage your emotions during the life cycle of a trade setup.
- Manage your emotions during small dips (streaks of losses).
- Keep trading the same way, unless your long-term results are questionable.
Generally speaking humans are weak in two aspects, which is why trading is often so difficult for traders:
- Assessing probabilities. People tend to believe that a 30% chance of rain means that there is in fact 0% chance of rain. Of course, in reality, the actual chance is 3 out of 10 but people struggle to comprehend probability.
- Accepting losses. The pain of a loss is psychologically much more difficult to accept than the pleasure from a win.
Probability is a difficult concept to comprehend and most people tend to overestimate something that is very unlikely or underestimate something that is actually quite likely.
- Unlikely events: the author Rolf Dobelli mentioned in this book “The Art of Thinking Clearly Book” that people respond to the expected magnitude of an event, but not to its likelihood. He added that humans lack an intuitive grasp of probability, which leads to errors in decision making.
- Likely events: the same example of a 30% chance of rain works great as an example. In fact, a 30% chance of rain is actually quite likely but many people complain about the accuracy of the weather forecast if it does rain on such a day.
- Conclusion: 30% chance of rain of a likely event is seen as unlikely (point 2) but a 0.1% or 0.01% chance of an unlikely event but with huge impact seems likely (point 1). Humans have difficulties in correctly assessing and using probabilities for their decision making.
- Impact on trading: this human bias impacts the decision of traders as well. Traders are known for:
- Overreacting to new information on the chart: a small change on the charts might make a trader think that the odds have significantly shifted.
- Underreacting to new information on the chart: a large change on the charts might not receive enough attention from a trader.
- Focusing on being correct: traders tend to care only about the win percentage being as high as possible, even though this increases the chances of losing big when things go wrong. The correct approach focuses on profitability which is a combination of win percentage and the avearge win versus average loss ratio.
- Focusing on winning the current/next setup: traders tend to care whether the current or next setup is a win. The correct approach is to focus on the consistency of long-term (40-50 setups at least) results.
Why Do Patterns Sometimes ‘Fail’?
Although many chart patterns are surprisingly reliable for predicting the next price move, they are not a dead certain either.
That’s because they can morph seamlessly into a different pattern from what one might have expected.
We can only ever know for sure what pattern has formed in hindsight because by the time it is 100% confirmed, the trading opportunity it would have provided is already over.
Trading is a continuous analysis of the path of least resistance, which can change as price action and the chart provide new information. This new information changes the old perspective and makes your analysis, your trade idea, your open trade setup, or the price pattern more or less likely. This in turn impacts the expected chances of a setup.
A concept found in quantum physics / mechanics has a remarkable parallel to chart patterns and trading. It is called ‘wave function collapse’.
Put very simply, wave function collapse is the moment when a particle of matter first becomes measurable or definable in any way (i.e. it ‘collapses’ from a potential into something observable). Prior to that, it exists more in an undefined state of potentiality, where it could still turn out to be one of several things. However quantum mechanics can to a certain degree predict in advance how a ‘wave’ will collapse into a particle.
We engage in a very similar process when we trade chart/wave patterns. We can predict what price is going to do next to a certain degree. But the pattern will never be 100% confirmed until after it has played out. There is a certain sweet spot; a moment when just enough price-action has played out to validate our analysis, while it is also still early enough to make the trade entry viable.
That’s why it is better to be more selective with the setups you choose (i.e. choose only the best). Once we are committed, we have to trust in the quantum vacuum, the field of potentiality, to deliver the final result.
That is why it is a best practice to keep analysing the new information available on the chart because it provides new information about whether the observable is forming the pattern or wave that you expect.
To make sure that we are analysing the charts based on reality rather than on a clouded judgment based on our bias, it is important to use invalidation and confirmation levels and invalidation and confirmation patterns.
Here is a summary of how to tackle trading:
- ANALYSE: triangle of analysis.
- DECIDE: like a chart or not.
- DECISION ZONE: key zone.
- DIRECTION: trade direction.
- SPACE: available space.
- TRIGGER: confirmation at decision zone.
- ENTRY: entry after trigger.
- TRADE MANAGEMENT: changes after entry.
You can use the concepts of invalidation and confirmation levels and patterns for all of these steps. Whether you use them for your analysis, for the chart patterns that you see, for deciding whether to trade, if to trade at the decision zone, in which direction, whether the space is useful for not, whether there is a trigger or not, whether an entry is still likely, or whether the open setup is working as expected.
The concepts of invalidation and confirmation allow you to setup boundaries along the expected path of least resistance and confirm whether price is still following that path or whether it is likely to move into a different path. More is explained in our special Elliott Wave Patterns & Fibonacci Relationships Core Reference Guide.
Once again, trading is a continuous analysis of the path of least resistance, which can change as price action and the chart provide new information. This new information changes the old perspective and makes your analysis, your trade idea, your open trade setup, or the price pattern more or less likely.
The path of least resistance can also change due to other financial markets as there is larger interdependence, interconnection, and interaction between the stock market, currency market, commodities, bonds, stock indices etc. A small change in one asset can, through the butterfly effect, cause much larger changes in the system.
Tying It Together
These are the key lessons:
- Candlesticks provide information on buyers versus sellers.
- Candlesticks and candlestick patterns make up price swings.
- Understand the importance of identifying price swings.
- Understand how to find the start and end of price swings.
- Price swings are either impulsive or corrective and bullish or bearish, which is the heartbeat of the market and charts.
- Identify price swings via AO, swat.FRACTALS, zigzag, and momentum and correction.
- Price swings make up price patterns.
- Wave analysis is just simply identifying and labelling price swings and patterns.
- Labelling price swings / waves only makes sense once you can identify swings.
- The charts are fractal in nature, repeating on all time scales. swat.FRACTAL indicators help show the fractal nature of the chart.
- The fractal nature of the charts is part of Chaos Theory, which explains that traders can understand the financial charts in a more advanced way when they are able to understand, recognize, read and interpret patterns – patterns repeat.
- The Chaos Theory also explains that:
- Charts repeat throughout time, which means trends and S&R concepts add value.
- The charts can either be in a trend (positive feedback loop), reversal (positive feedback loop), or range (negative feedback loop).
- Charts offer underlying patterns, like chart, divergence, time, wave patterns.
- Self-organize: lower time frames can impact and help explain higher time frames and vice versa.
- Price, charts, financial instruments follow the path of least resistance, which is based on repetitive impulsive and corrective patterns (Fractal/Chaos Theory).
- The chart is a continuous battle between energy (impulse) and gravity (price back to mean and average).
- Price moves away from MAs if there is sufficient force, but retraces back to MAs (like a gravitational force) once force is slower than the strength of S&R. These movements make waves.
- The path of least resistance can be analysed by using the triangle of analysis, which is price patterns, support and resistance, and trend and momentum.
- The path of least resistance helps determine decision zones, direction, triggers, entry, and trade management.
- Traders can analyse the expected path of least resistance better in the short-term, up to 7 candles, than in the long-term as more factors can affect the price path. Time patterns help traders understand the chart by allowing 5-6 candles to confirm impulse, or else price is correcting.
- The chart is our road map for understanding the path of least resistance but everything on the charts is a probability.
- The probabilities of patterns playing out can change depending on new information.
- Patterns and the path of least resistance can change, which is based on the ‘Wave function collapse’ from quantum physics.
- The most difficult part is identifying the correct pattern and understanding when the patterns are likely/looking to break down (fail) or be confirmed. Once you can identify it, then you can trade it.
- Use invalidation and confirmation levels and invalidation and confirmation patterns to place boundaries on the expected path of least resistance.
- If price stays in the path, then the path of least resistance is being confirmed.
- If prices move away from the path, then the current path of least resistance is (being) invalidated and a new path becomes more likely.
- The patterns create a trading bias. But you need a bias to trade. Trading without any bias will mean lack of commitment to the trade. Use invalidation and confirmation levels and invalidation and confirmation patterns to base your analysis and trades on reality.
- Base your bias on patterns and analysis and use it to build up experience.
For more information, free analysis, webinars, videos, tools, systems, and methods for trading stocks, cryptos, Forex and options, please check out my website www.EliteCurrenSea.com.
Wish you good trading,
Chris Svorcik


Leave a Reply