Learn How to Avoid 4 Errors when Drawing Fibonacci Tool

Dear traders,
Do you also have problems with finding the correct price swing for placing the Fibonacci tool?
Although the Fibonacci tool is great for entries and exits, the tool needs to be placed on the chart manually and placing the Fib on the wrong price swing could cost dearly.
This article explains how to avoid 4 critical errors when drawing the Fibonacci tool on any price chart.
When Do Fibonacci Levels Work Well
The Fibonacci retracement levels are a great method for measuring the market psychology. The Fibs provide a lot of value because of the market psychology: traders know that a trend can continue after a pullback to a Fibonacci retracement level and hence the levels are often well respected in the market.
The traders and the markets gladly accept the discount (within the trend) and use these levels for buying lower and selling higher.
There are 3 important criteria when using Fibs – otherwise the tool might not work that well:
- Prerequisite: the presence of a trend. There must be a trend visible otherwise if the market is ranging, the Fibonacci retracement levels will not be used and will have no meaningful impact on price movement.
- The Fibonacci retracement tool must be drawn on the correct price swing otherwise the price will not respect the levels. A price swing is one single price move from top to bottom.
- Even if the Fibonacci retracement level is drawn on the correct swing, not each and every Fibonacci retracement level will be respected. On average, expect them to work 2 out of 3 times.
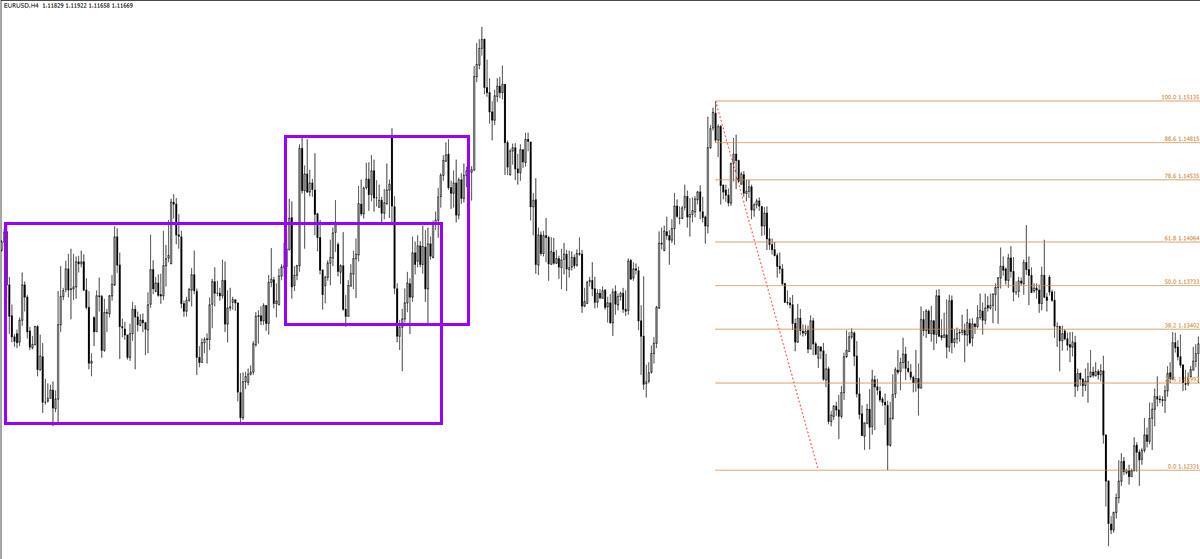
How to Avoid Using the Wrong Price Swing
Choosing the correct price swing for placing the Fibonacci is one of the main problems with using the Fib tool. Fibonacci is a very valuable method and tool but traders must place the tool on the swing that makes the most sense for current market conditions.
This will mostly be a discretionary choice, which is one of the main problems with Fibs. Traders will always face some risk of using an incorrect price swing for placing their Fibonacci tool.
If price breaks the top or bottom in the opposite direction of the expected price movement, then price has invalidated the chosen price swing.
Here are the 4 main reasons why traders place the Fibonacci tool on the correct price swing.
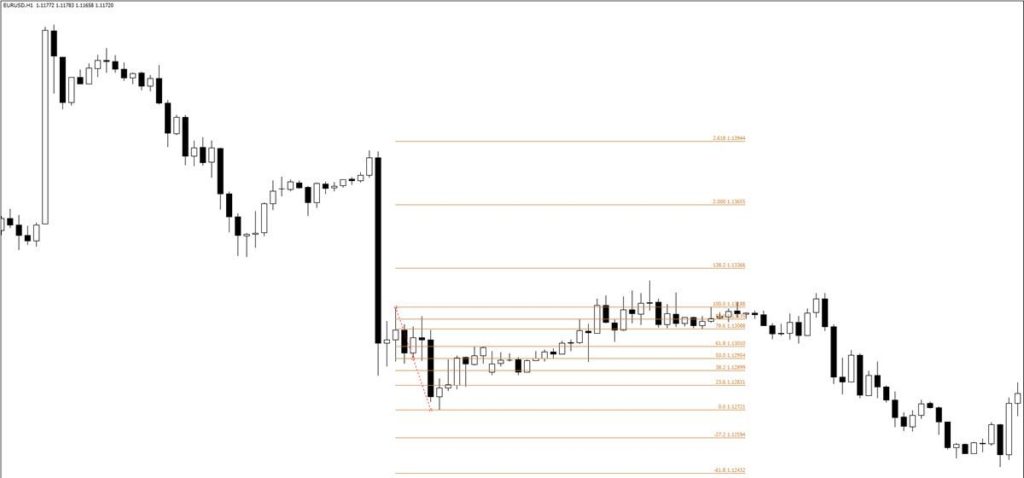
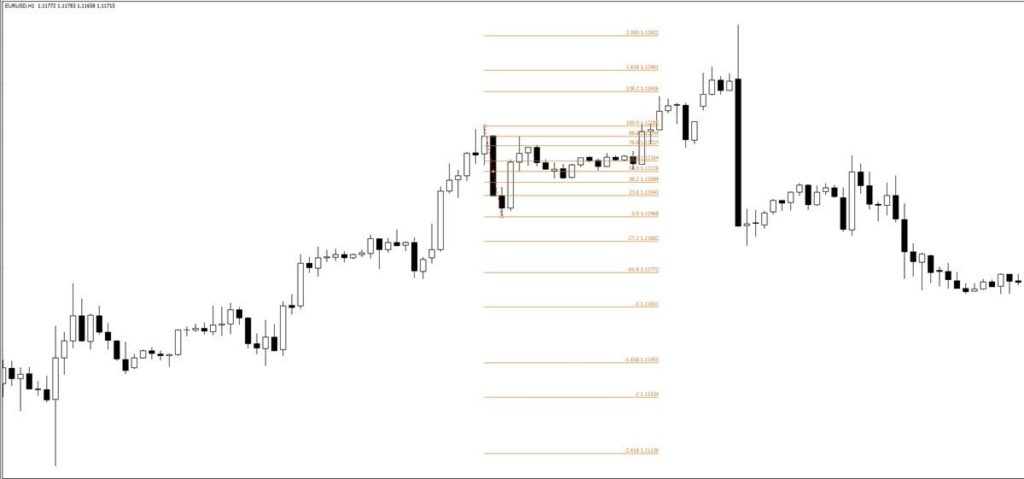
- Used a too small price swing.
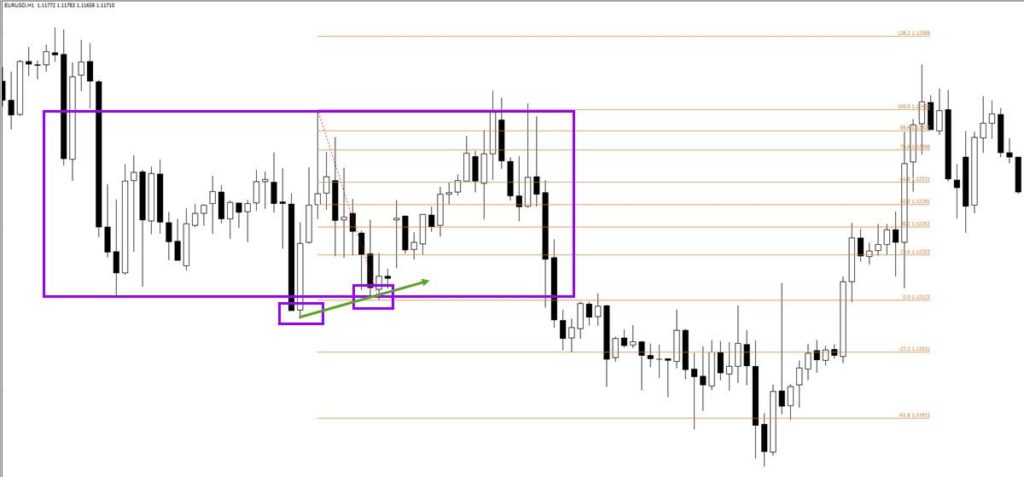
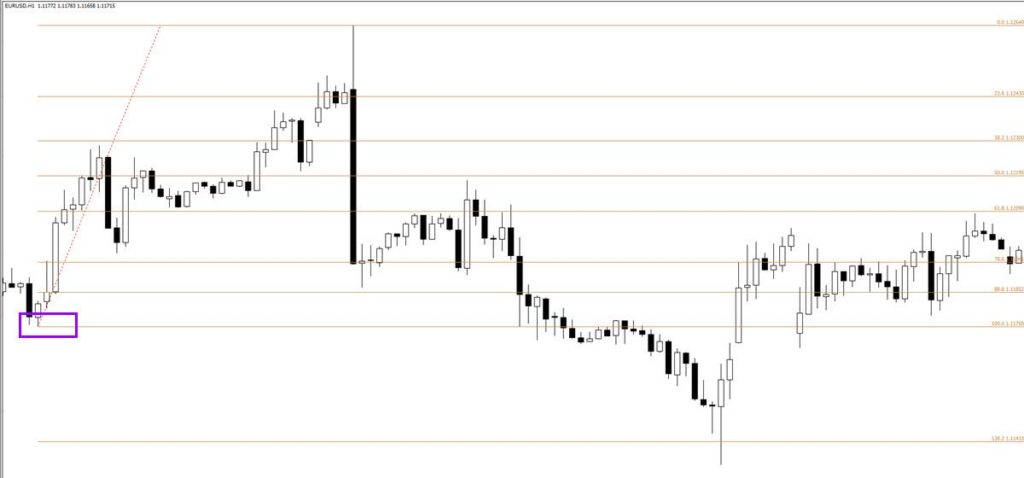
- Failed to see a ranging price environment.
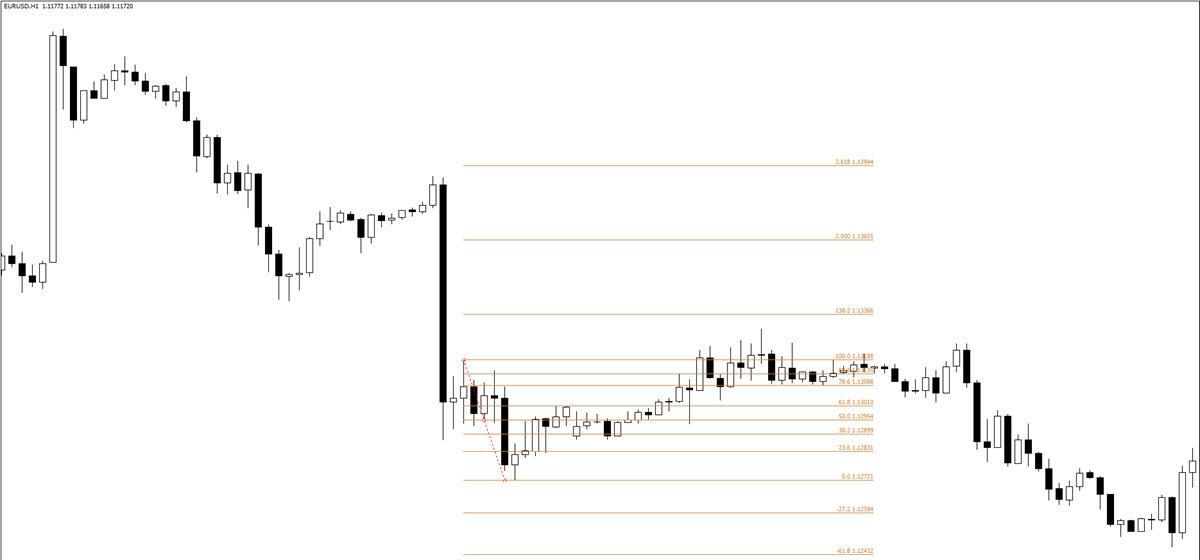
- Wrongly anticipated a reversal.
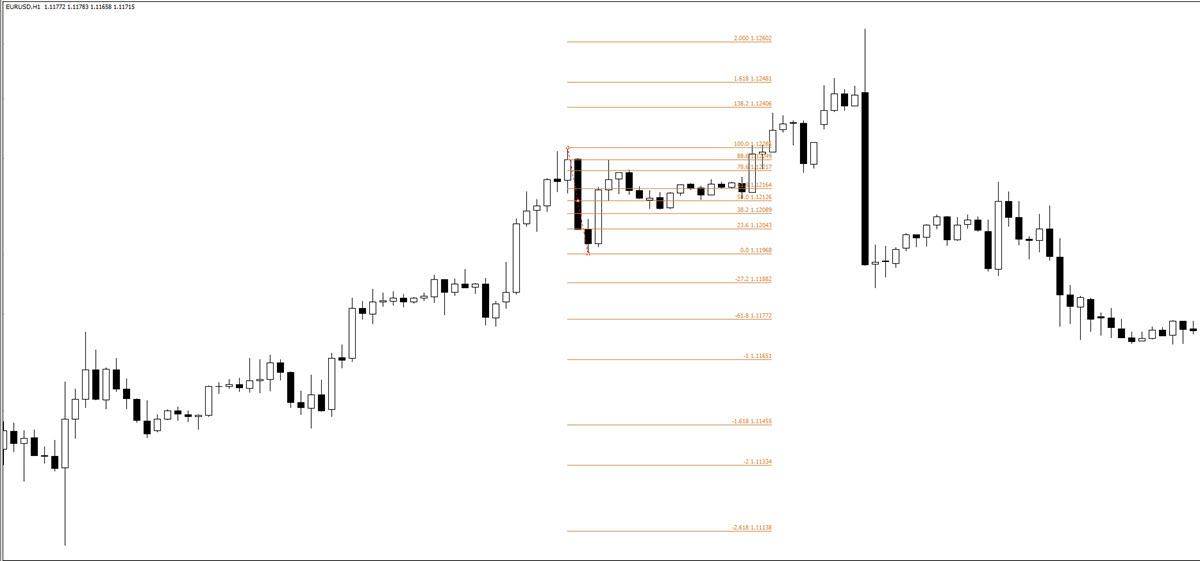
- Counted on a failed trend continuation.

Two Simple Solutions for Fibs
There are two primary ways how to solve the problems with drawing Fibs on the chart:
- Focus on trend and momentum.
- Using the logic price swings for placing the Fibonacci tool.
Traders can avoid using the Fibonacci tool at the wrong moments if they focus on using the Fib tool when the market is trending and/or impulsive. If the currency pair is trending OR showing momentum then the tool is a great asset.
Fibs however do not work well in consolidations, corrections, ranges and sideways moves, because the levels are mostly ignored and price is more responsive to different levels such as tops and bottoms. More is explained in our special Elliott Wave Patterns & Fibonacci Relationships Core Reference Guide.
In trending or impulsive markets the Fib levels indicate precise levels where there is a high chance of the market turning back in the direction of the trend. It is good to realise that price respects different Fibonacci levels depending the market circumstances:
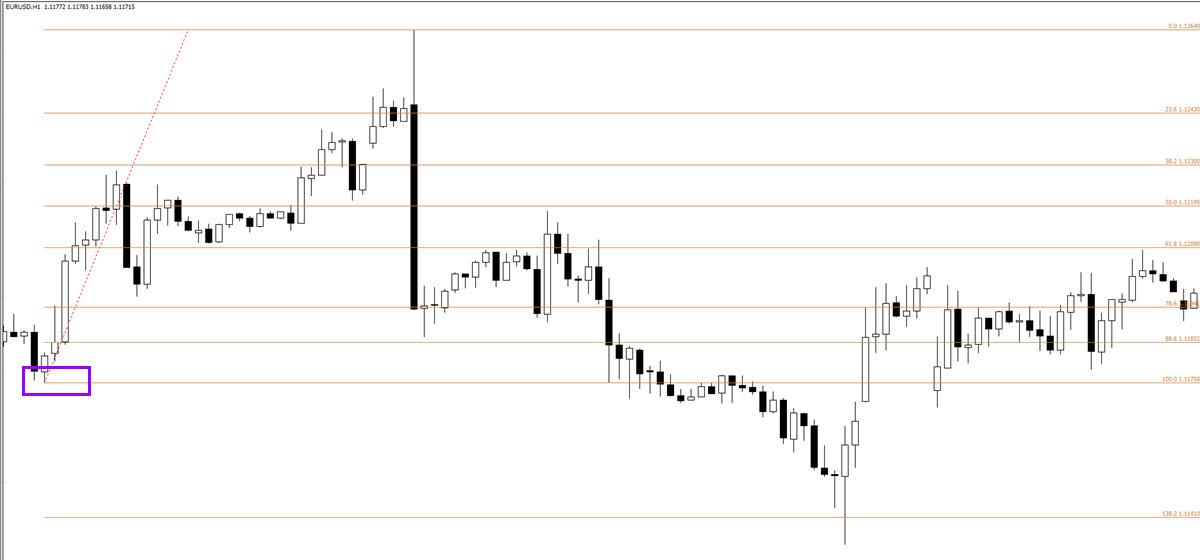
- Deep pullback (61.8-88.6%): price tends to make a deep pullback when a trend is not yet clearly established. In those cases price can make multiple ups and downs which severely test the bottom (uptrend) or top (downtrend) but without breaking those levels (which would invalidate the trend).
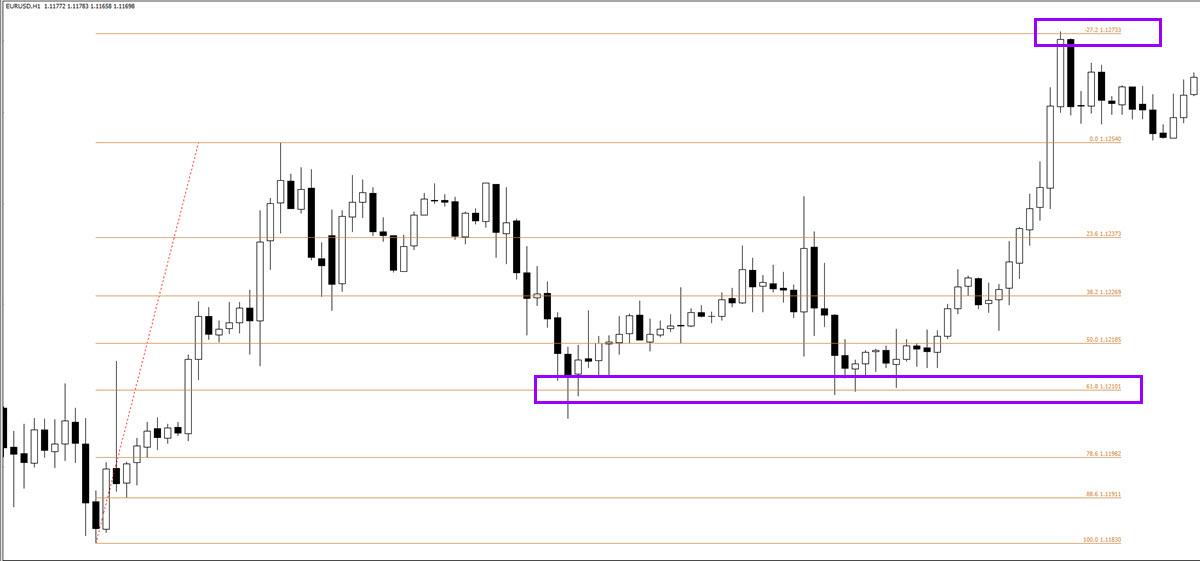
- Shallow pullback (23.6-50%): once a trend has clearly established itself then a shallow pullback such as the 23.6%, 38.2% and 50% half way mark are generally levels, which are very typical before the trend continues.
Good trading,
Chris Svorcik


Leave a Reply