Elliott Waves – Filtering Out Bad Wave Counts
Subscribe
Dear Traders,
Elliott Wave counting is as often judged as being too subjective. It’s true that the possibility exists for extreme personal bias to creep into a wave analysis.
But there are numerous ways by which we can keep such personal distortions in check and come to the highest probability forecast.
Today’s article will discuss what to bear in mind during wave analsyis including a practical example.
Cultivating Objectivity
The tricky thing about Elliott wave forecasting is that there is often more than one possible option for price to unfold from any given point in time. In the heat of our predictive fervor, it is easy to get so focused on what we think ‘should’ be happening next, that we forget about the other possibilities.
It is very useful to take a breath, step back from your preferred wave count idea and deliberately try to find alternative ways to label the swings you are wanting to define. This will train you out of being in fixed mindset and look at the chart with fresh eyes again.
Of course, the main tenets we need to adhere to are the Elliott wave rules. If we go off on a wave-count tangent, while leaving the rules behind, we venture into the realm of delusion and will soon end up making bad trading decisions. This point cannot be emphasized enough.
Guidelines Help Counting
However even when we abide by Elliott wave rules, there will still be situations when the rules of more than one wave pattern can be validly applied to a set of swings. This is the time when Elliott wave guidelines are an important additional filter. The guidelines for each wave pattern are a set of features that tend to appear most often. They are not an absolute must, unlike the rules, but they provide good additional validation for a wave count. So it is best to go with the option that ticks as many guideline features as possible, in addition to adhering to its rules. All guidelines (and rules) can be found in the book “Elliott Wave Principle – Key to Market Behaviour” by Prechter and Frost.
It’s also important to keep in mind how common or rare a wave formation is. Some patterns, like a running flat for example, is very rare and it is therefore better to check if the price action can be labeled in some other way before settling on a wave pattern that is extremely rare.
Example
So let’s walk through a current example of the GBP/USD and see whether if we can apply these ‘best practices’ to this rather tricky but intriguing price action.
I have discussed different possibilities for the larger wave count of the GBP/USD in this previous post. Since then, price has unfolded in manner that gives further weight to the bearish scenario #1, which the article was talking about. I will therefore go by this overall picture which mainly considers Minuette wave (ii) complete at the march 26 high, and focus today’ exercise on the price action since then.
A series of bearish 1-2 waves into the Apr 5 low is questionable because price broke above the high of 1.4096 during the latest bullish impulse, and is still behaving more horizontally than vertically (the latter would be more present in a series of 1-2, 1-2). It would also make the 1-2 of lesser degree a much bigger structure than the 1-2 of higher degree, which does not fit comfortably into the relevant guidelines either. The 1-2, 1-2 scenario was much more likely still before the last bullish reaction but it is now probably wiser to shelve this idea.
Another wave pattern option for the price action since the Mar 26 high could be a leading diagonal (image below). It almost fits all the rules; expect that wave 5 is shorter than wave 3, which should invalidate this option too.
So there are two other options that could fulfill all rules, one bearish and one bullish:
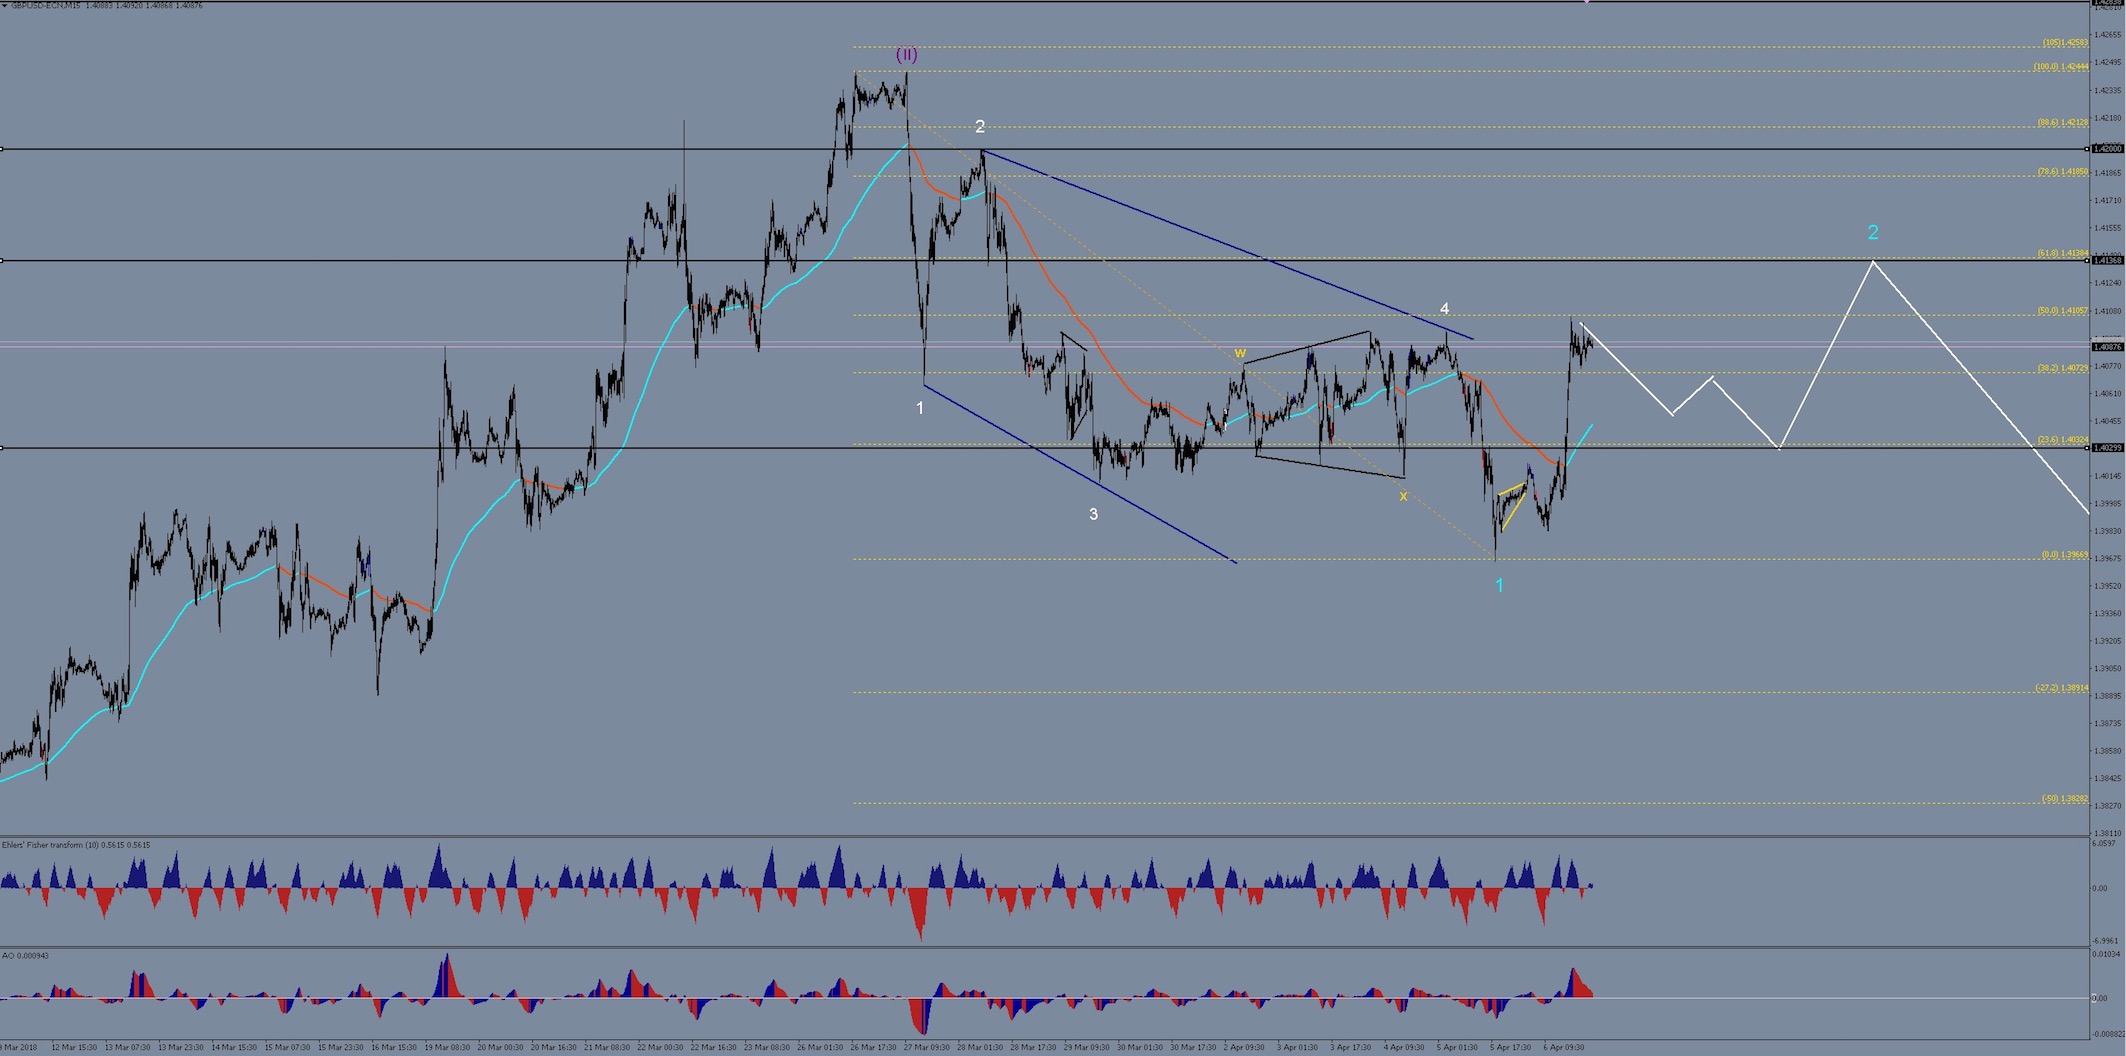
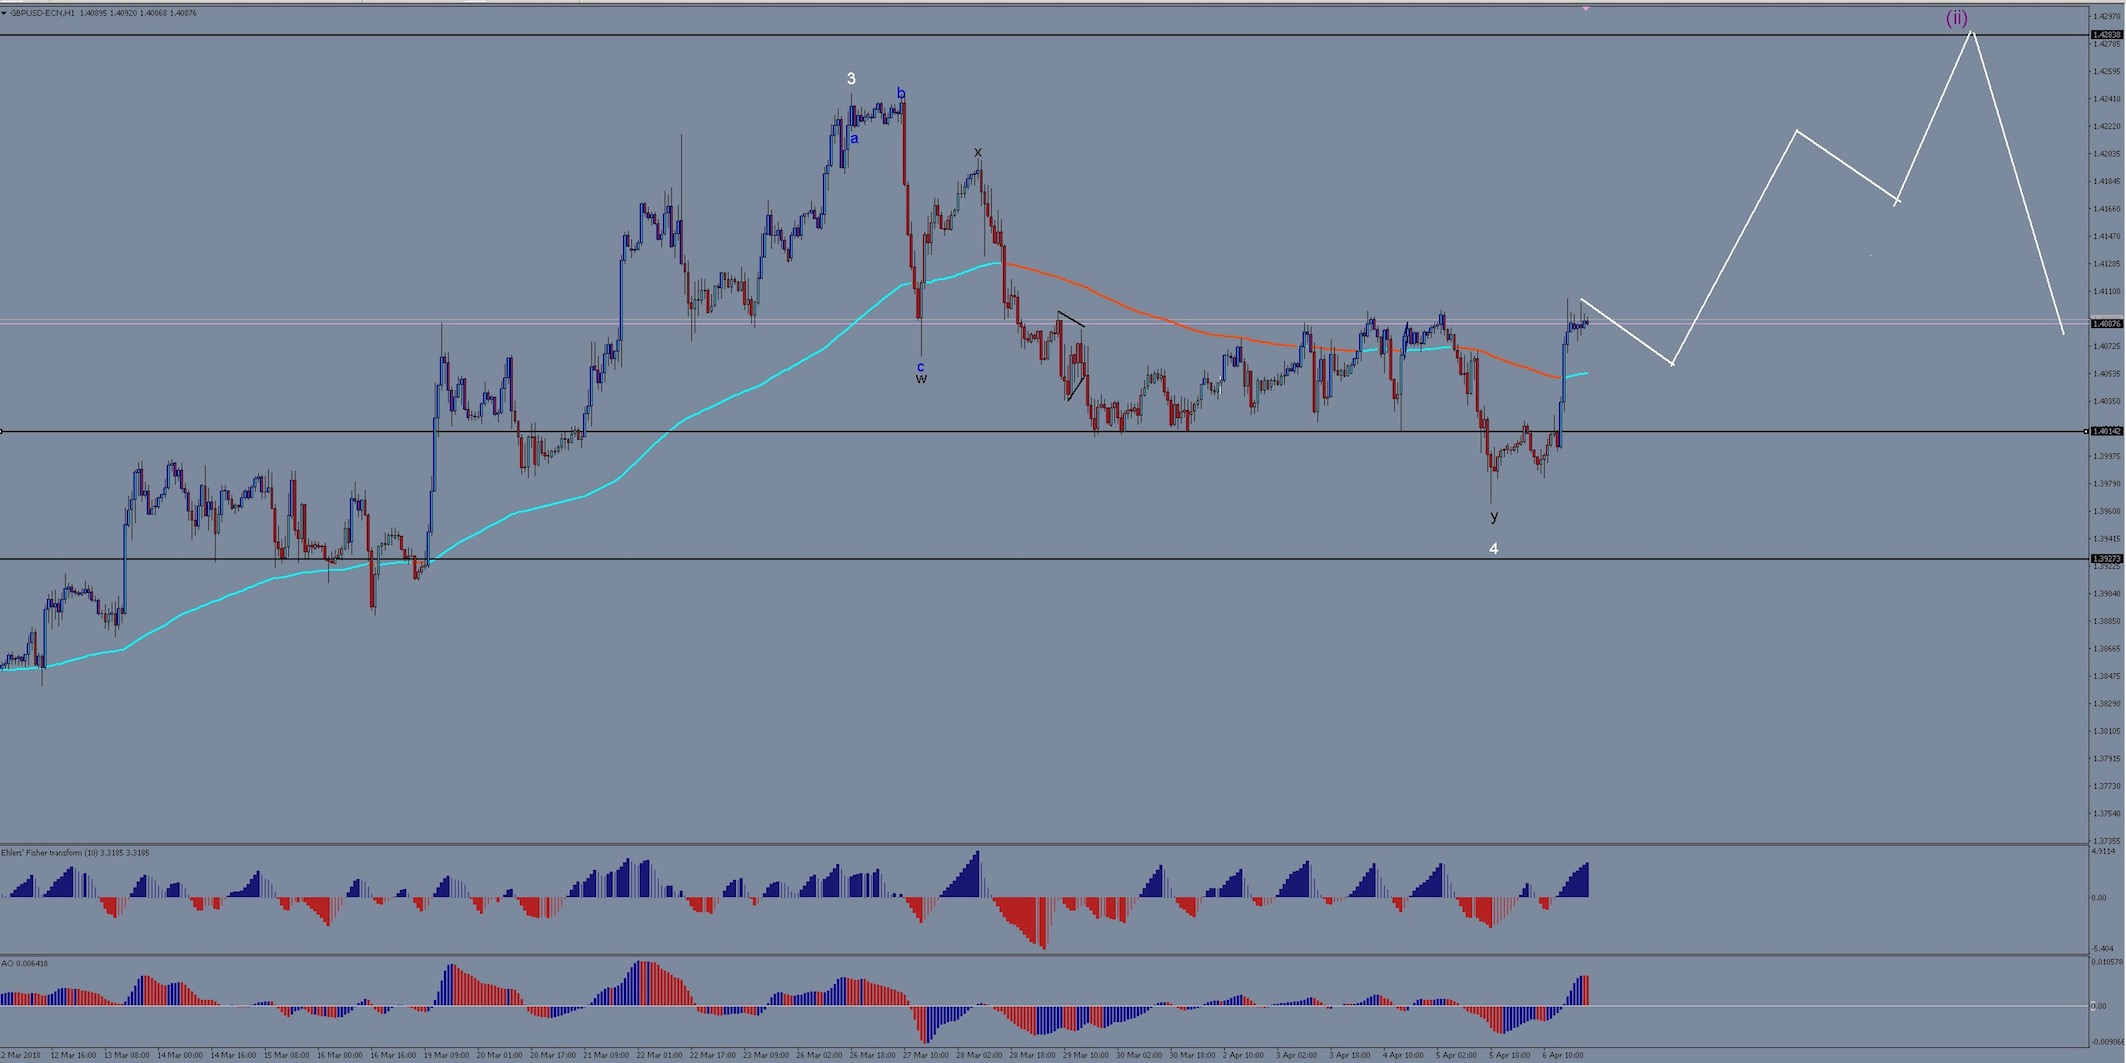
Bullish Option: The below image shows how a corrective wave count could be squeezed into the price. A double zigzag (wxy) would need to be applied into the Apr 5 low. Although this meets all the rules, the first zigzag needs to be horribly skewed to fit, with a miniature wave a and an enormous wave c. This makes it an uncomfortable fit but, nevertheless, a valid option. The implication would be another high above the Mar 26 high but below the January high to finally complete minuette wave (ii) (purple) before a bearish descent begins for real.
Bearish Option 2: The below image shows a bearish wave count, which applies a single impulse to the downside into the Mar 29 low, followed by a complex sideways correction as wave 2 (turquoise) that could have completed on Friday. The complex correction would then consist of a flat (black w), an expanding triangle (black x) and an expanding flat(black y). This idea seems to tick all the rule boxes too, but the bearish impulse has to be very awkwardly shunted to fit also, with an extremely deep wave 4. This wave count would imply a bearish impulse is coming next, starting from current price levels.

So all in all, we are seeing quite a tricky price-action in the cable. Both valid wave counts above still have niggling peculiarities, but they are the best scenarios at this point. Given that both options are showing divergence from normal guidelines, it may be best not to base any trading decisions on either of them until further validation for one or the other scenario appears early this week.
All the best along your trading journey
Hubert.


Thank you for a great article. Using EMA’s to help with wave counts, would it be better in your opinion to wait for confirmation of trend on the higher time frames, like the Four Hour. I tend to be more aggressive on the smaller time frames only to realise that the trend hasn’t actually started properly. Thank you
I used to always analyse the wave patterns on the larger timeframes first. I.e. weekly, daily and 4 hour. I would then only use smaller timeframes for entry after I am clear about the bigger picture… mmm makes me want to trade again ??
Hi Hubert, thank you for your reply! Lol, why would one want to stop trading!? ??