A Live Forex Trade Based on Fibonacci
Subscribe

In the recent weeks our full focus at Elite CurrenSea has been on Fibonacci. Grinding into the details is, we think, the best method to learn a topic quickly and efficiently.
During my live webinar at Admiral Markets on Forex trading, I was using the Fibonacci tool for a potential long entry on the GBP/USD. Let me explain the analysis why I was looking for an upside trade.
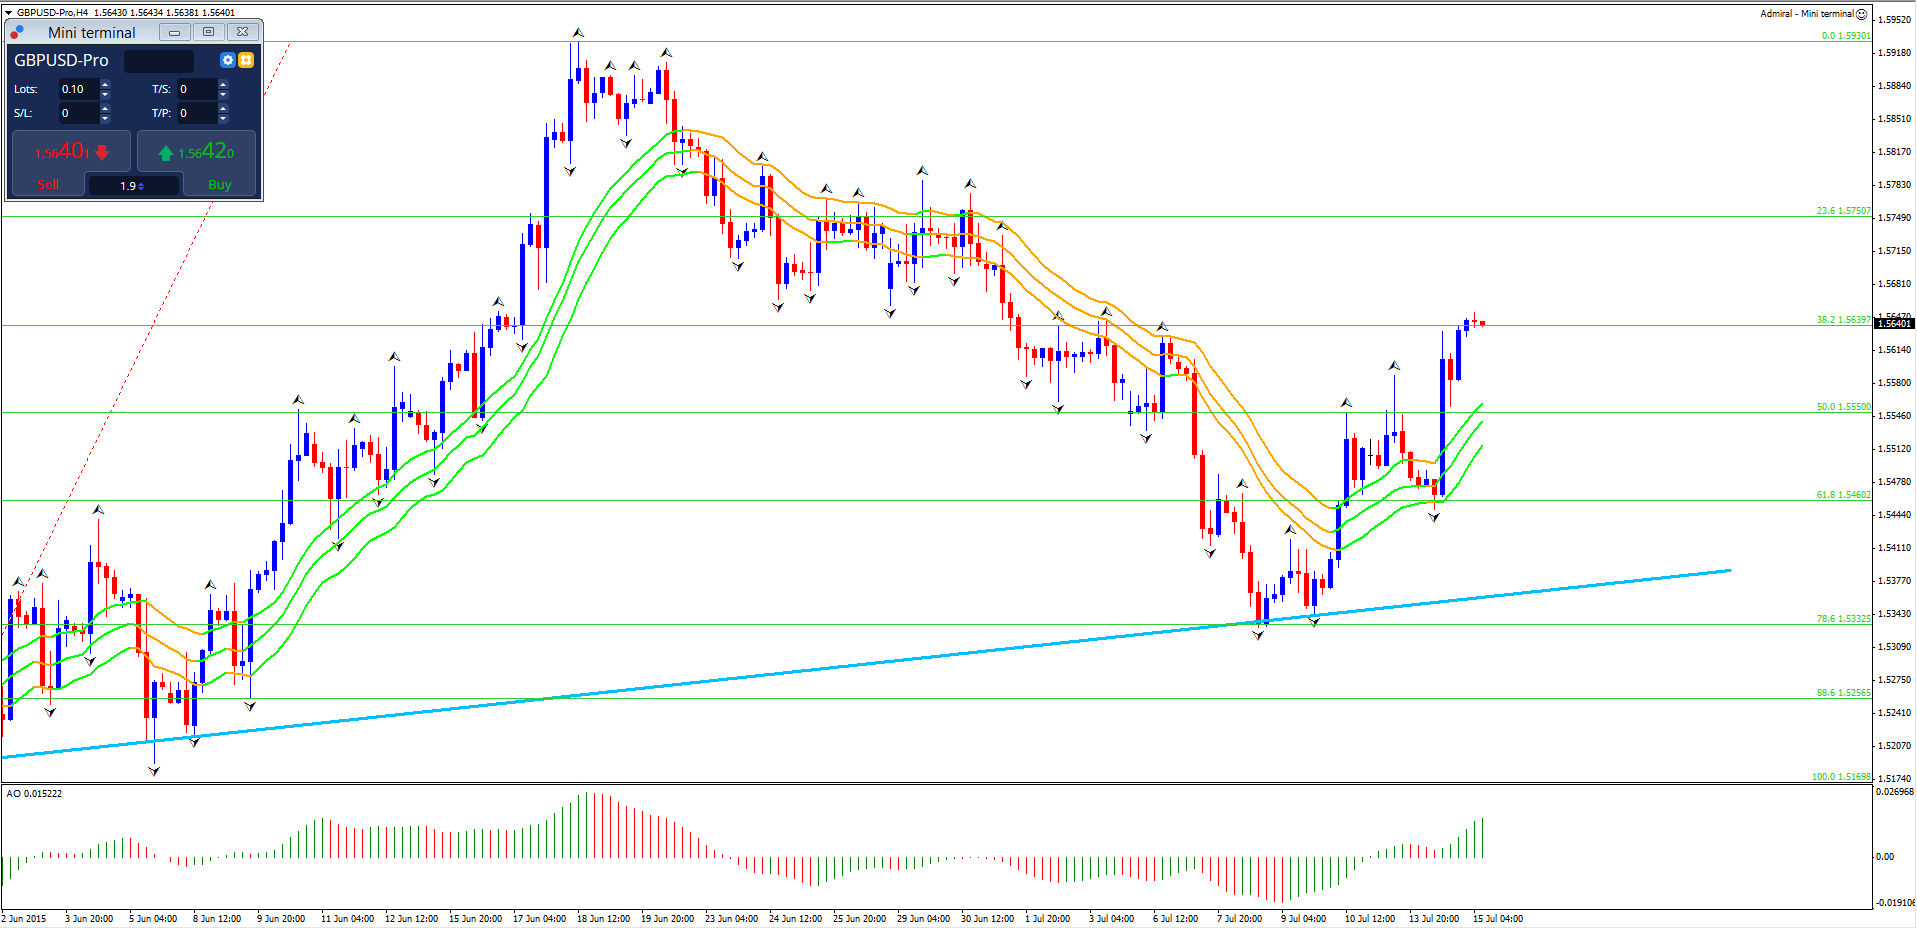
When reviewing the 4 hour chart I noticed that the GBP/USD:
1) Made a clear bounce at the support trend line (blue) from the daily chart;
2) Made a clear bounce at the 78.6% Fibonacci retracement level;
3) Made a strong bullish momentum after hitting the support with big bullish candles;
4) Made 5 moves up which indicates an impulsive price action as wave traders know all too well;
5) Broke above the 21 ema moving average band, which indicates the trend shift.
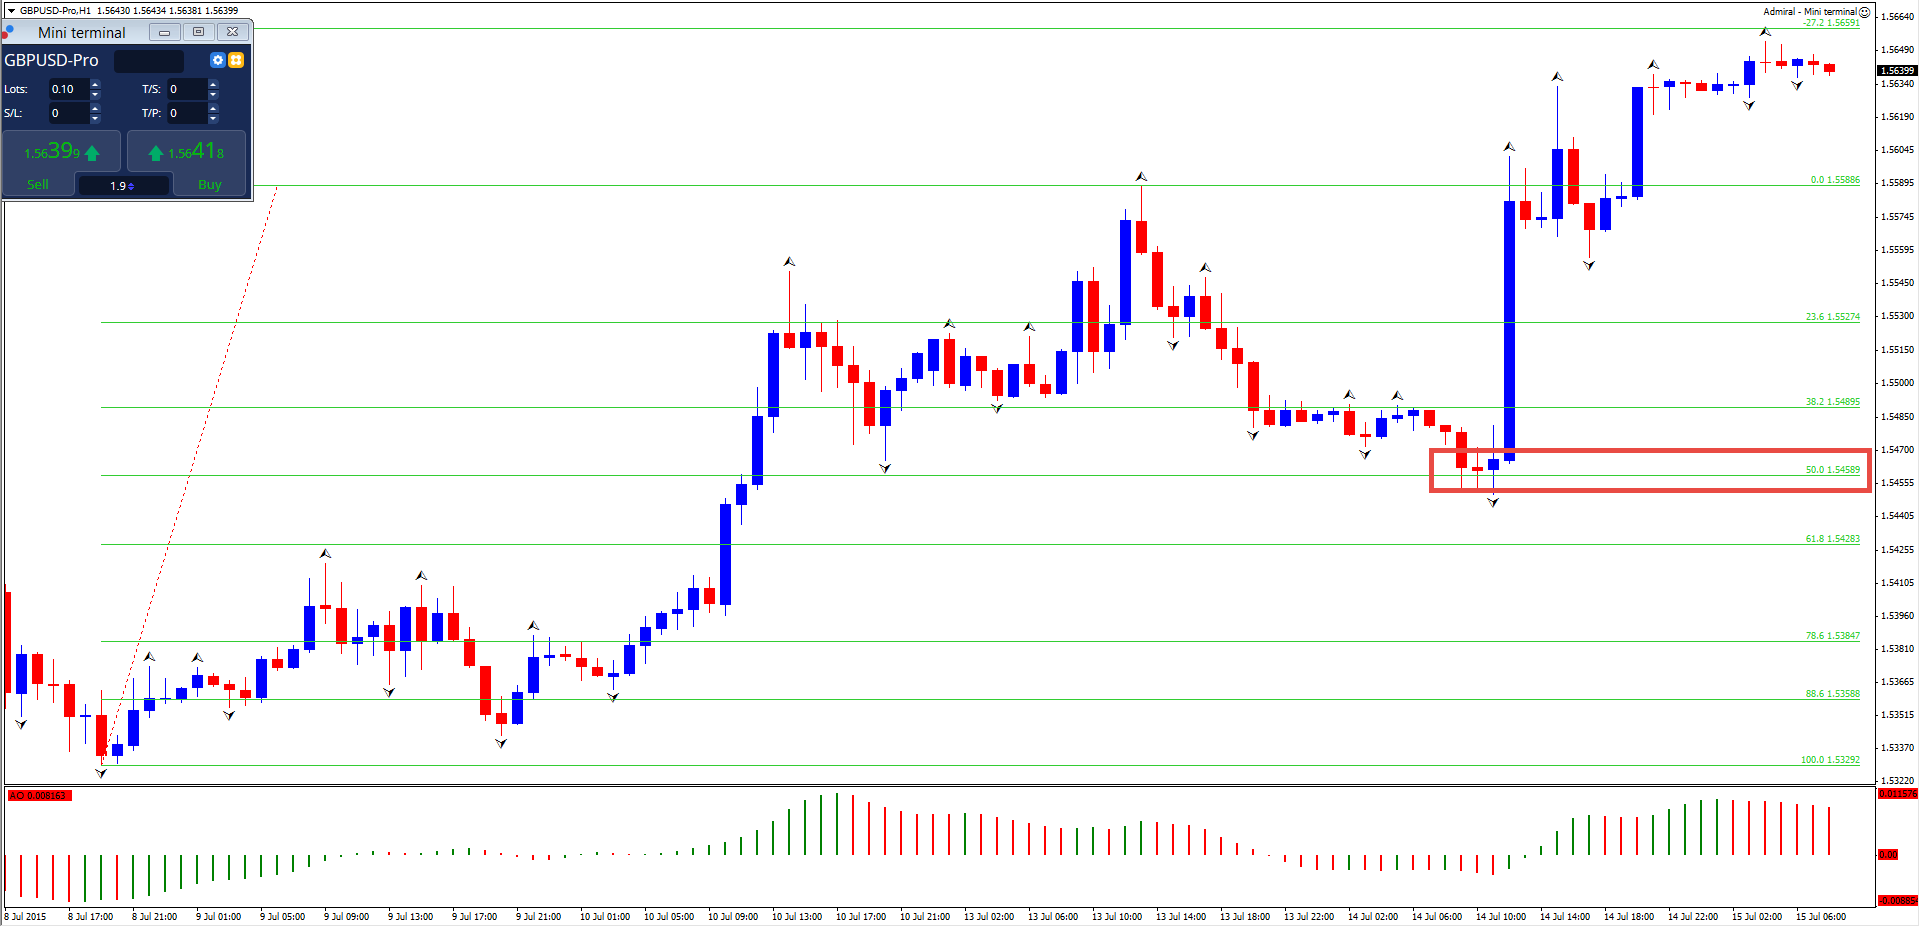
During the live webinar I therefore stated that I am looking for a long upon the pullback. I would be interested in any Fibonacci level, including the 50% or deeper if price continued to lower levels.
Therefore I placed a Fibonacci tool on the bullish moment on the 1 hour chart and saw that price had already reached the 50% Fib. This could easily be a bouncing spot.
My next step was to zoom into lower time frames like the 5 and 15min chart to establish whether price was going to:
a) BOUNCE at the 50% Fibonacci retracement level OR
b) BREAK below the 50% Fib and head lower to the 61.8%.
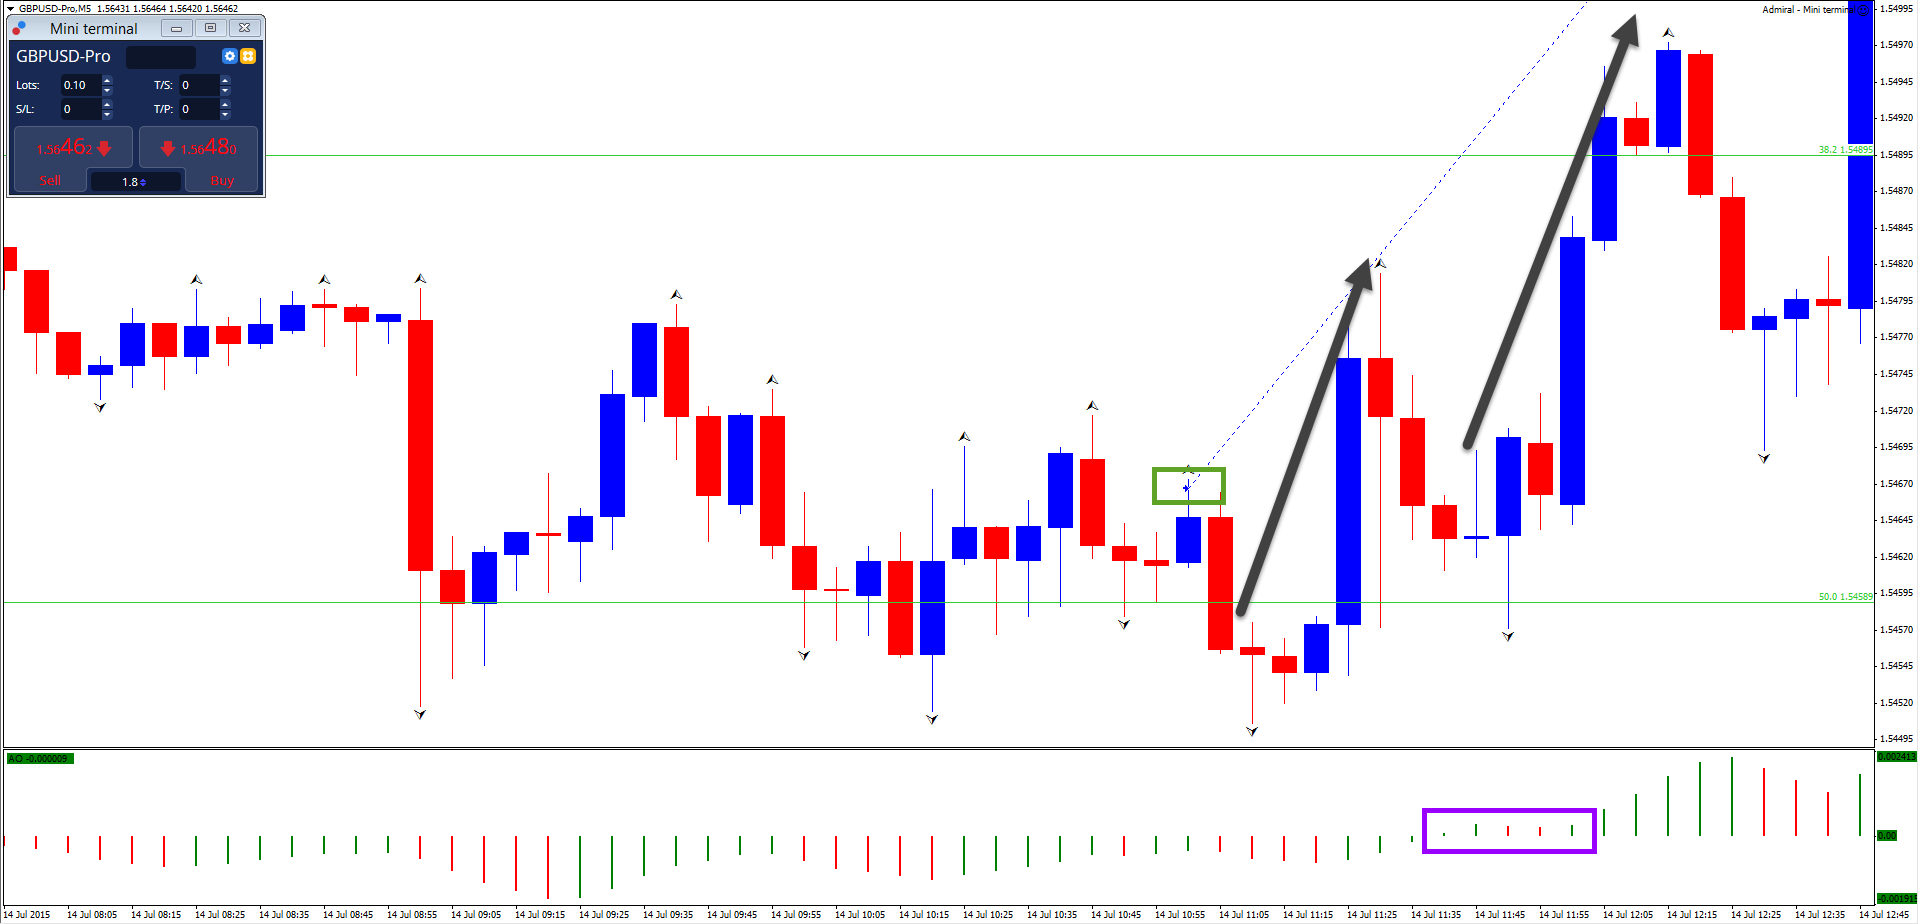
Eventually I used my time factor methodology for establishing the entry (green box). This method showed to me that the chance of upside had significantly increased. (please visit a webinar at Admiral Markets or write us an email to [email protected] to know more about the time factor method).
Also the awesome oscillator clear showed the decrease of momentum although the upside momentum was really only confirmed after the 2 smaller spikes upwards (black arrows and purple box).
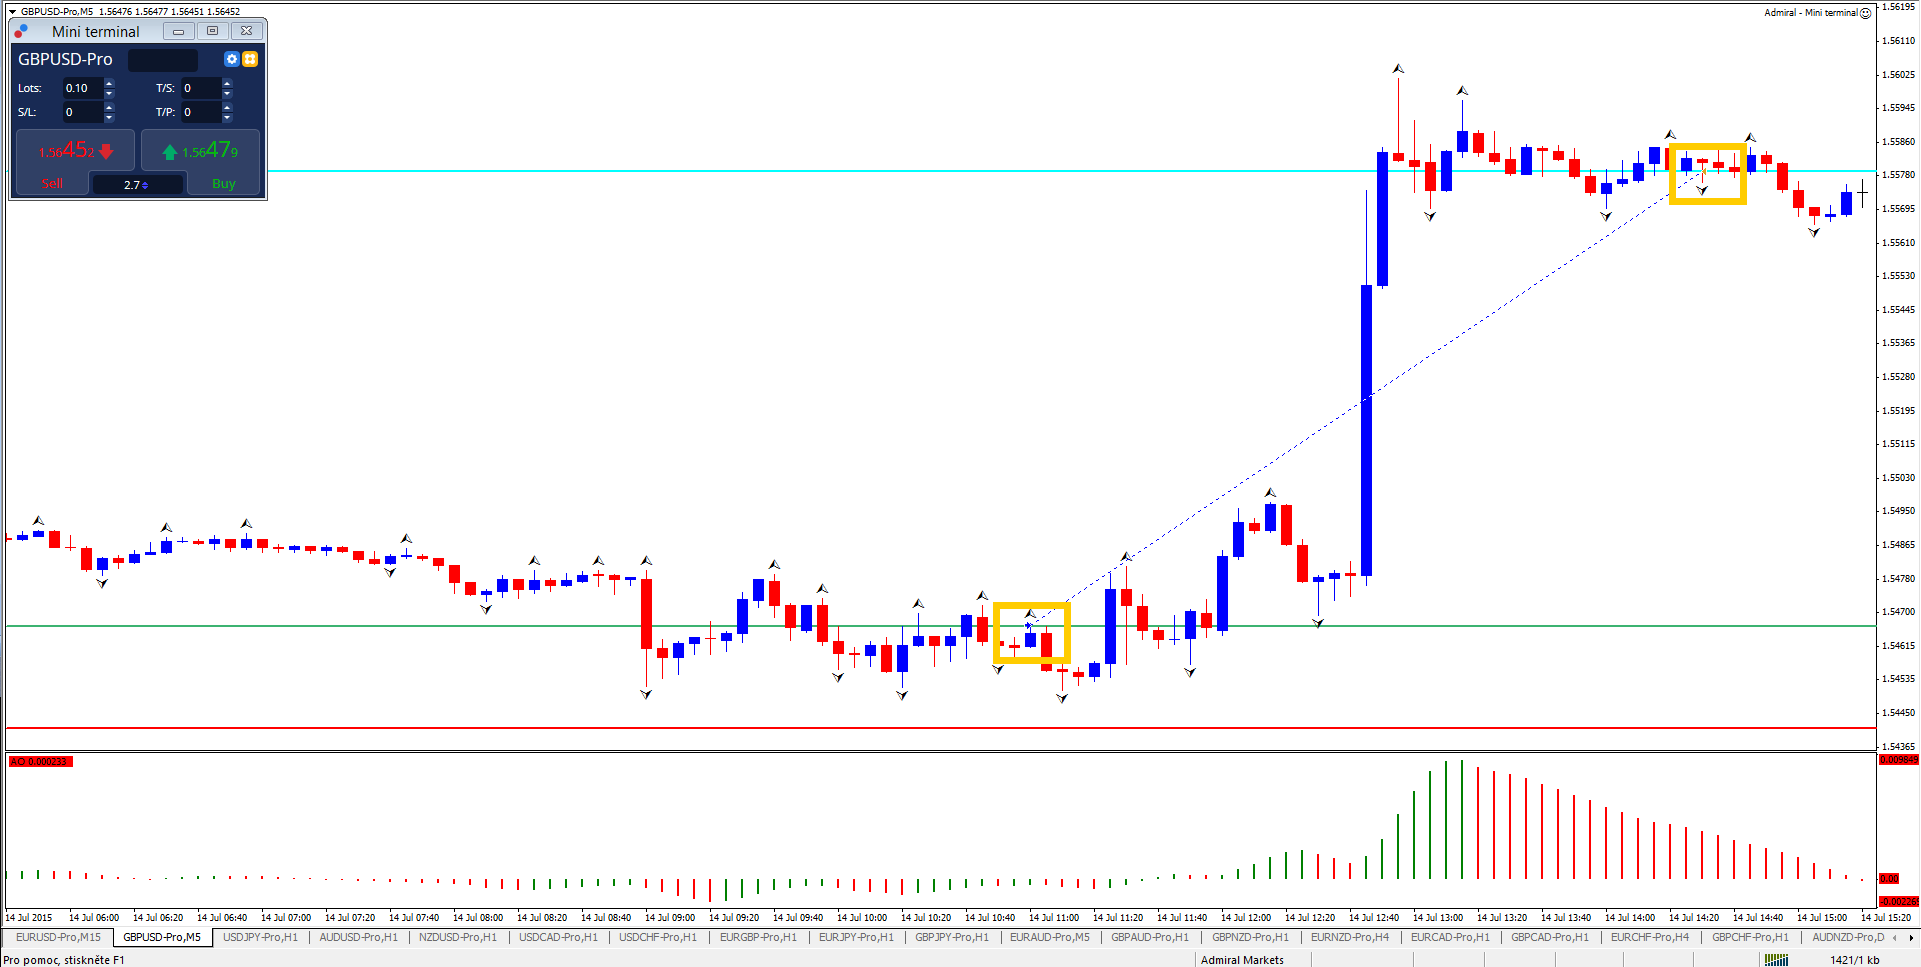
Eventually I exited the long trade setup on the GBP/USD after price was showing a decent consolidation zone. The blue line markets the exit where as the green is entry and red is stop loss.
The profit amounted to +112 pips versus a 25 pip risk.
That is a reward to reward to risk ratio of 4.48.
Join our Youtube Channel for great content!


Leave a Reply