EUR/GBP – End of Range ? Start of Bearish Momentum??
Subscribe
Dear Traders,
The EUR/GBP has been in an extensive range since late last year.
But wave analysis points towards a completion of the sideways correction and the start of more bearish momentum.
This analysis will take a quick look at this currency pair and highlight trade setups.
Wave Analysis Suggests End of Range
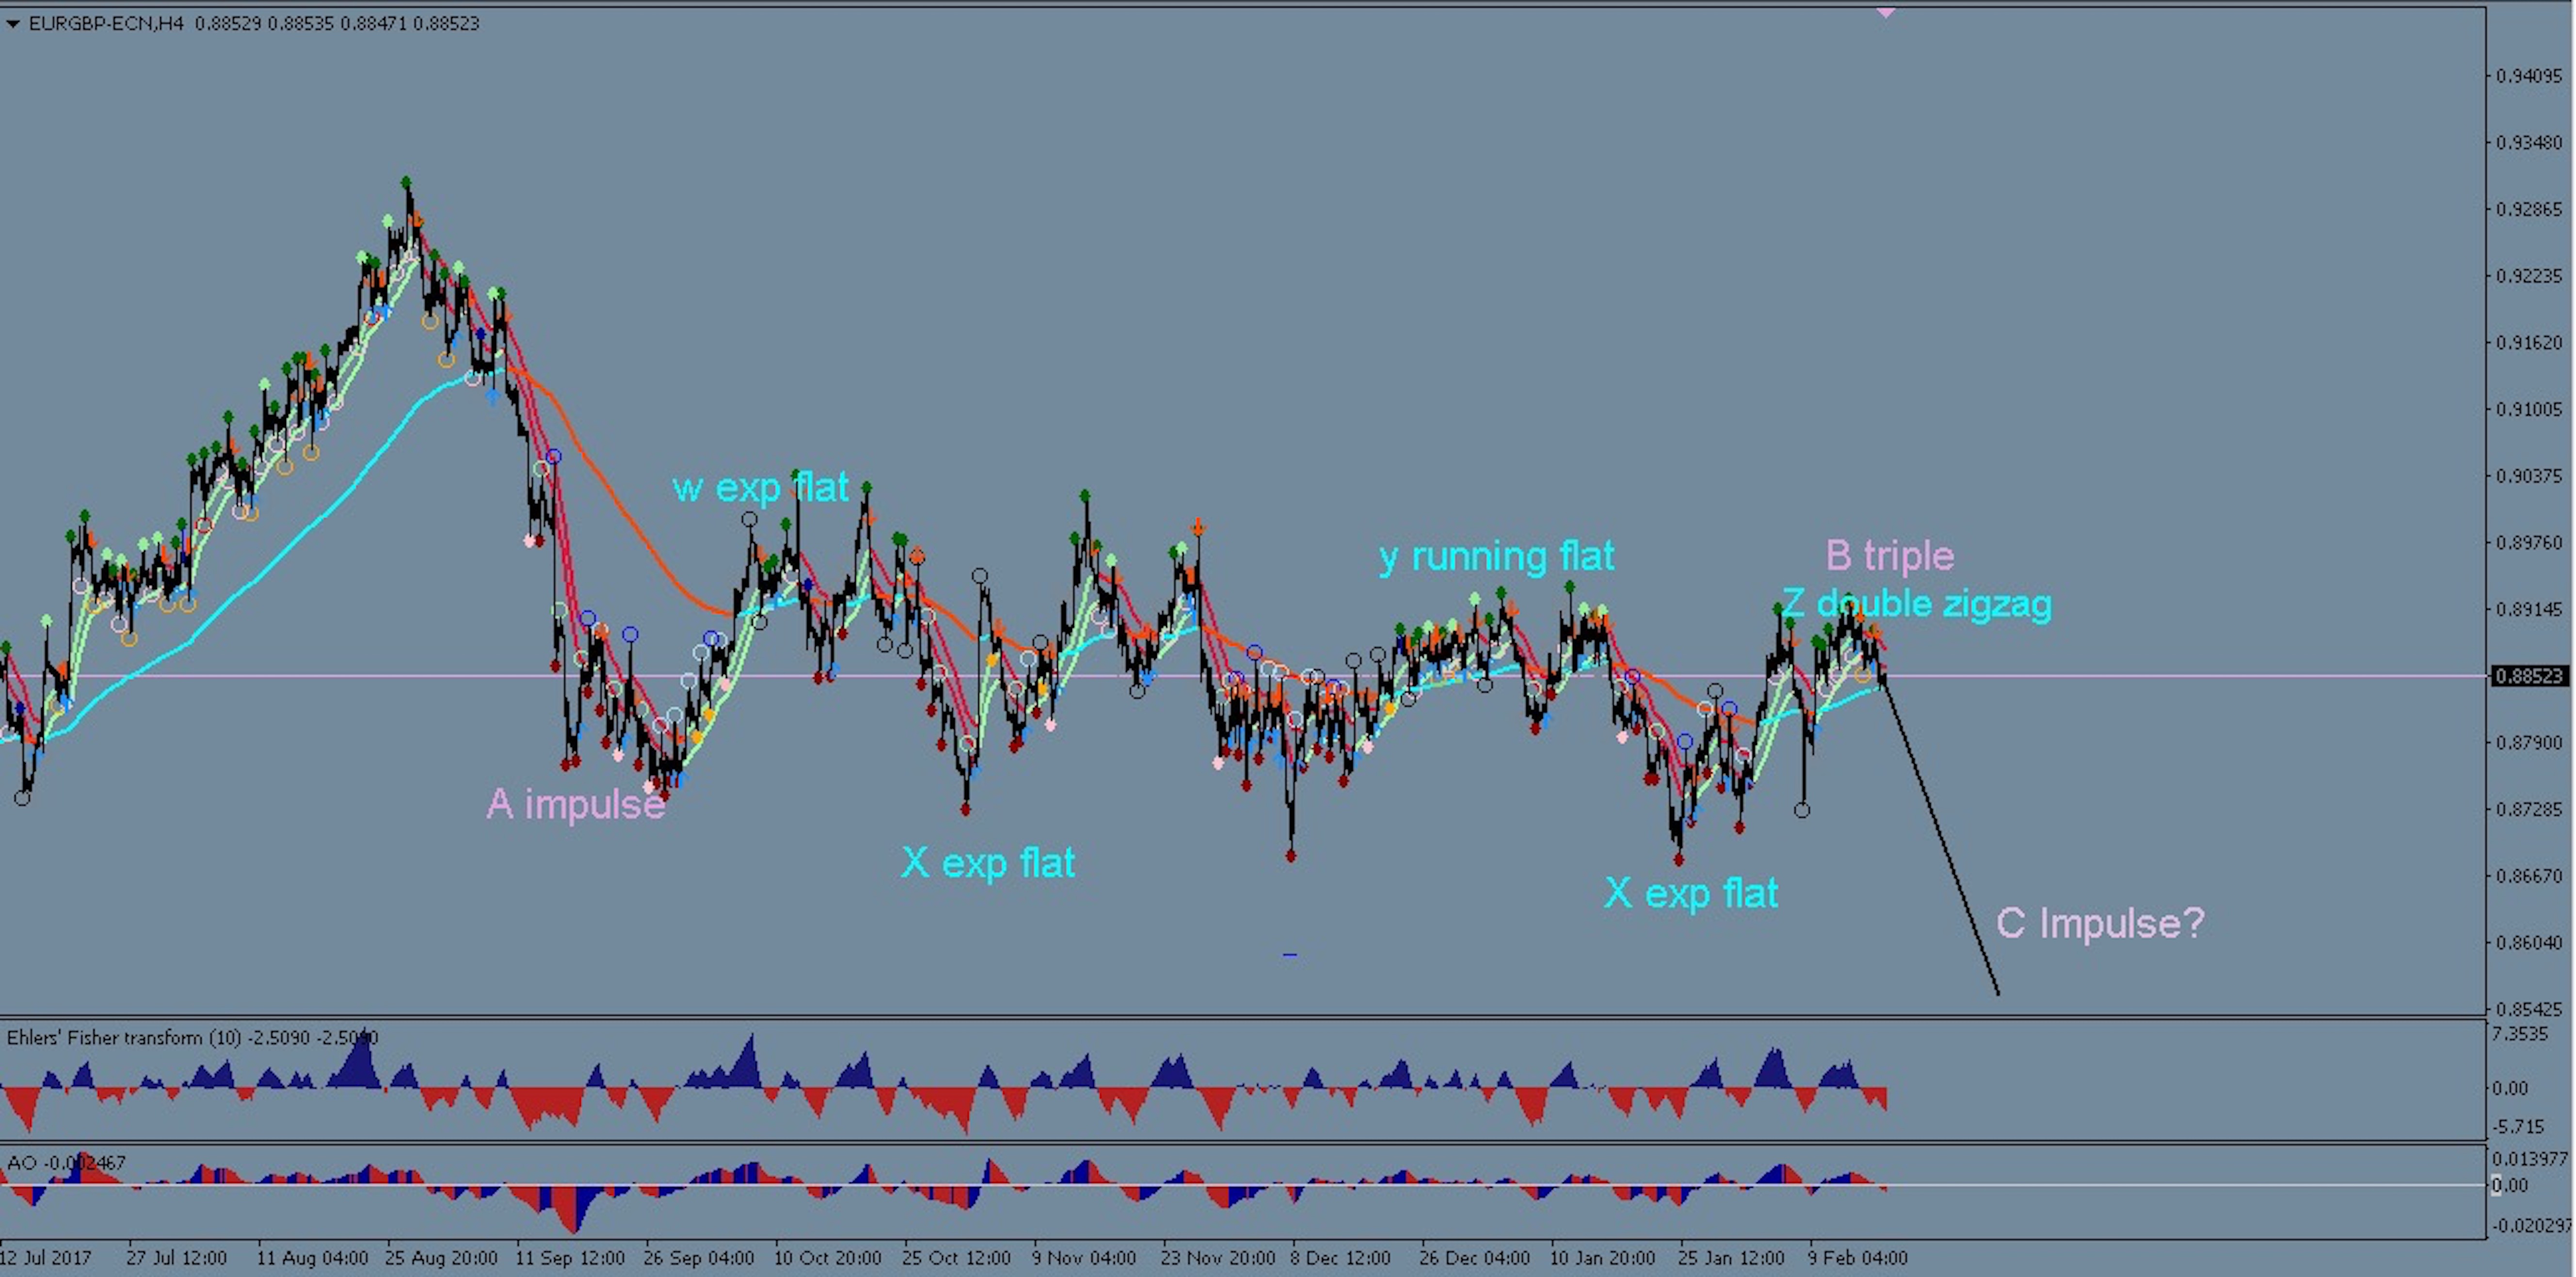
The chart above shows the extensive correction, which the EUR/GBP has traced out since Sep 2017. It has taken the most complex form of a ‘Triple’ correction, which now appears to be complete (see turquoise waves). Given that the first swing, which lead into the range, was a strong bearish impulse wave, it would fit well into Elliot Wave rules for another bearish impulse to commence now in order to complete the larger pink ABC ZigZag.
Trade Setups
 The close-up 4 hour chart (above) shows that price broke below the 21 EMA, but is still trading above the long-term moving average. Price action since the last high from Feb 14 looks promising for a build-up of bearish momentum.
We see two options for potential trade setups:
- Aggressive option: A SWAT signal has already appeared when price broken below the 21 EMA, so aggressive traders could enter now and hope for a break of the 144 EMA to follow soon.
- Safer option: Alternatively one could wait for a bearish 4 hour candle close that breaks below the 144 EMA, and then wait for a mild pull back before entering a sell position.
Targets for both trade options could be 0.8760 and 0.87 (support levels of the range), followed by 0.86 and 0.85, which are price levels that could easily be reached if we are indeed witnessing the start of a new bearish impulse.
All the best along your trading journey…
Hubert
.


Leave a Reply