How to Calculate “Net Liquidity” Post 2020 & Use It to Short S&P500

In July 2020, something unprecedented happened that allegedly allowed traders to accurately predict the future 95% of the time.
Those in the know claim to have made billions betting on the outcomes of these events, while everyone else remains unaware. Here’s how you can test this method to your advantage.
In a nutshell, the majority has been chasing the size of the Fed’s balance sheet and the Fed Funds Rate (FFR), but it matters less than you may think.
Don’t get us wrong, it used to matter a lot, but the world has changed since 2020; when to fight Covid, Fed unleashed the beast – 4.5 trillion in US dollars.
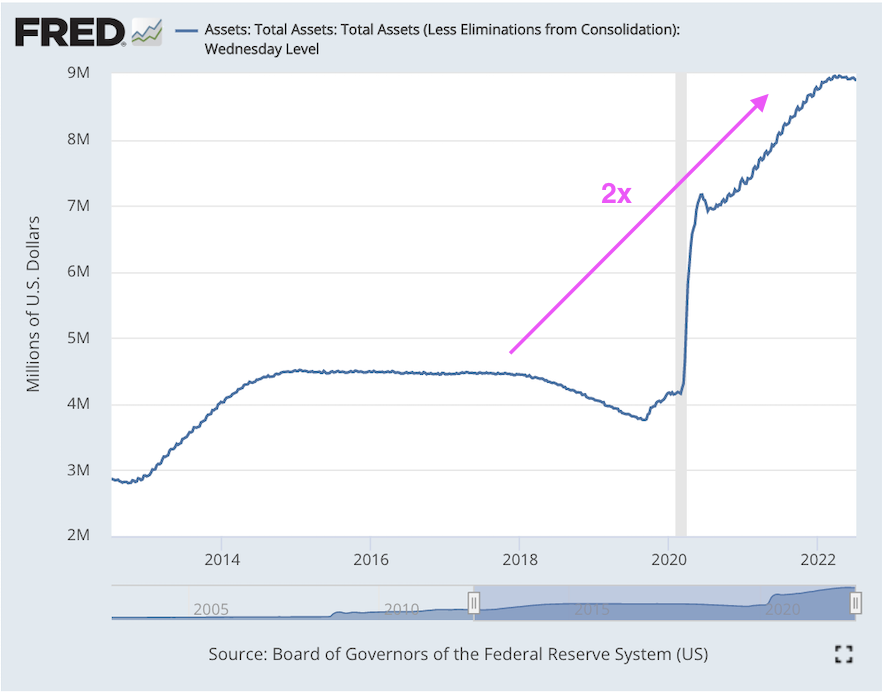
This has led to a doubling of the balance sheet. A known fact, so no surprises here just yet. What’s more intriguing that time around is that the US Treasury provisioned itself with 1.8 trillion dollars — 4.5x what it had ever done before.
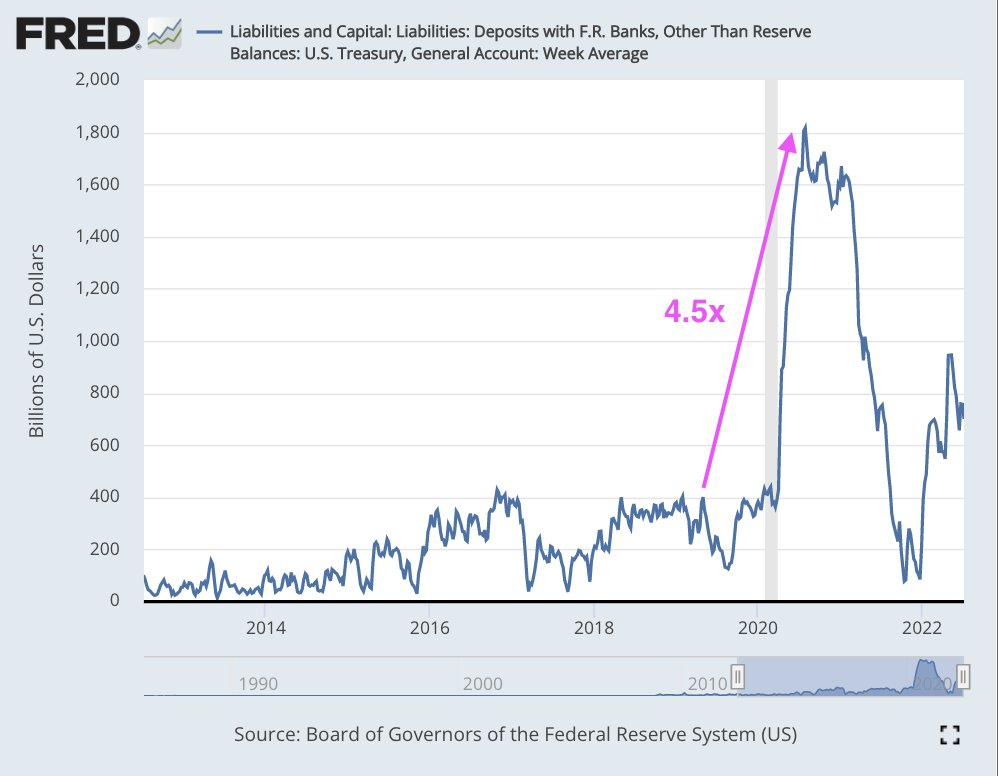
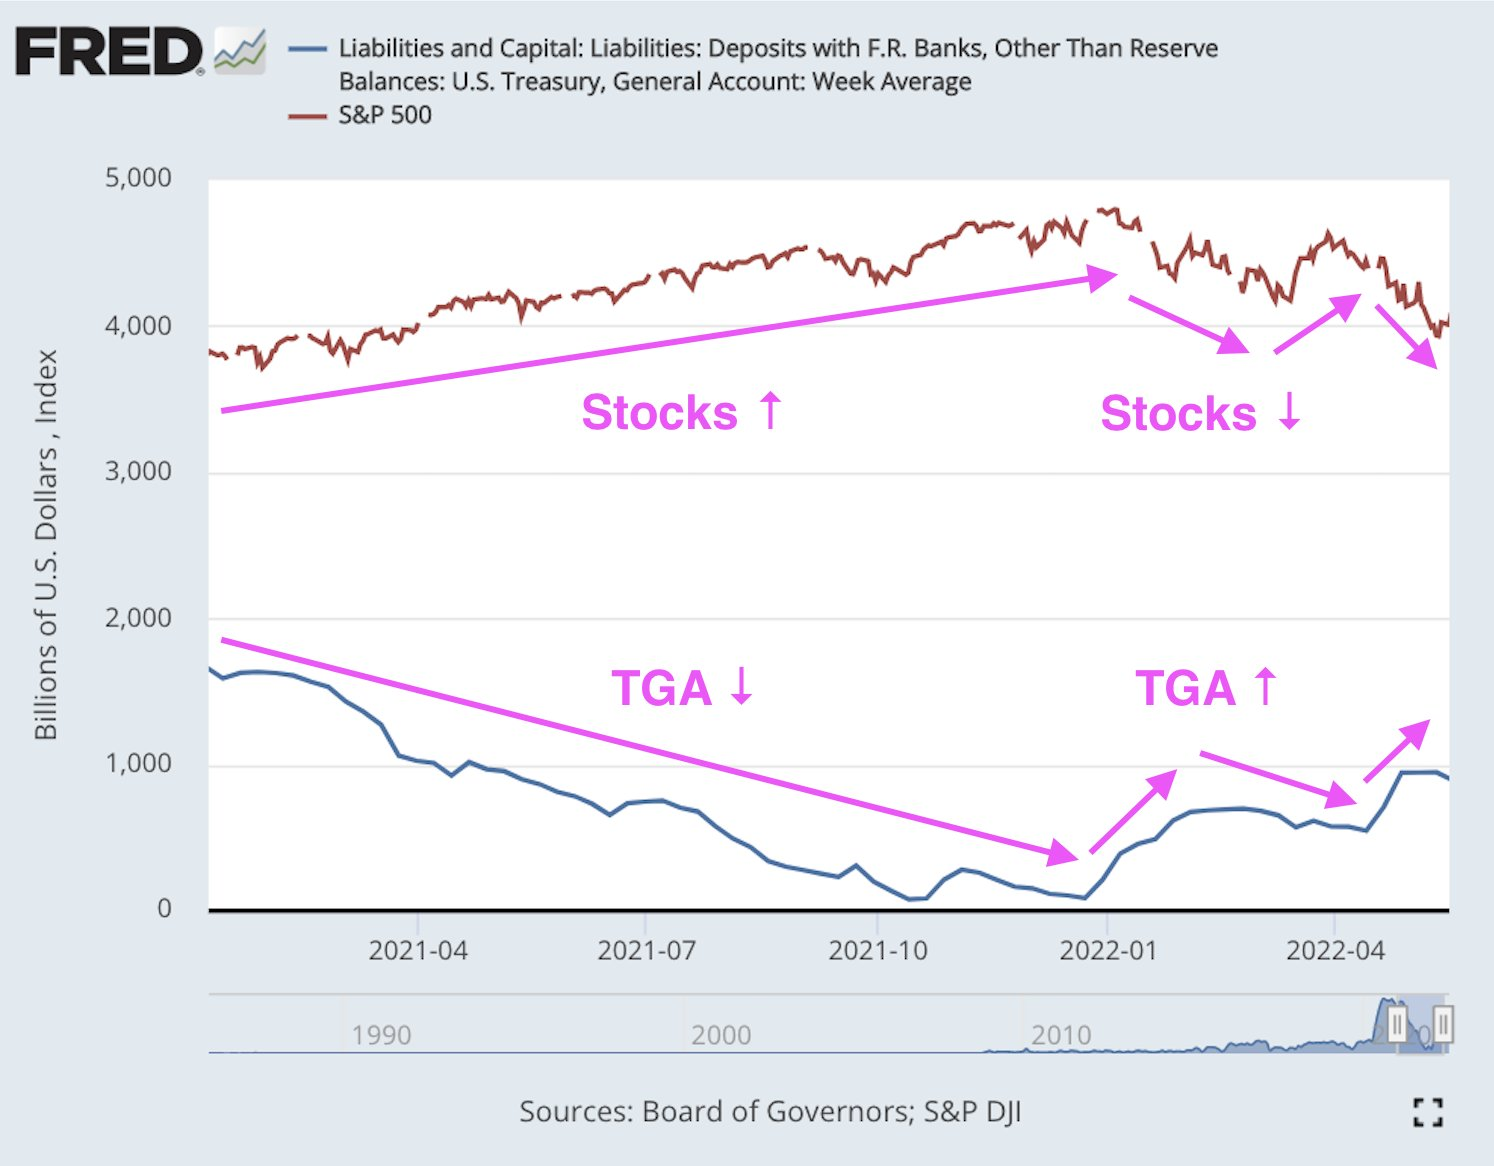
The Treasury’s firehose of money was so big it became the sole driver of markets. Liquidity took over as the only thing that mattered. $SPX snapped into a near-perfect (95%) inverse correlation with TGA balance.
Eventually, the situation got out of hand. The flood of liquidity drove the cost of living for Americans 33% higher in under two years It was a runaway shitshow with no sign of slowing down.
To try and conceal the influx of stimulus into the economy, they kept the market focused on old metrics, such as the Federal Funds Rate and the Fed’s balance sheet size, while coming up with another ingenuous idea.
Namely,
- Treasury issues less short-dated T-Bills. This created a shortage in the low-duration paper that financial institutions need to be able to provide liquidity to the economy, while;
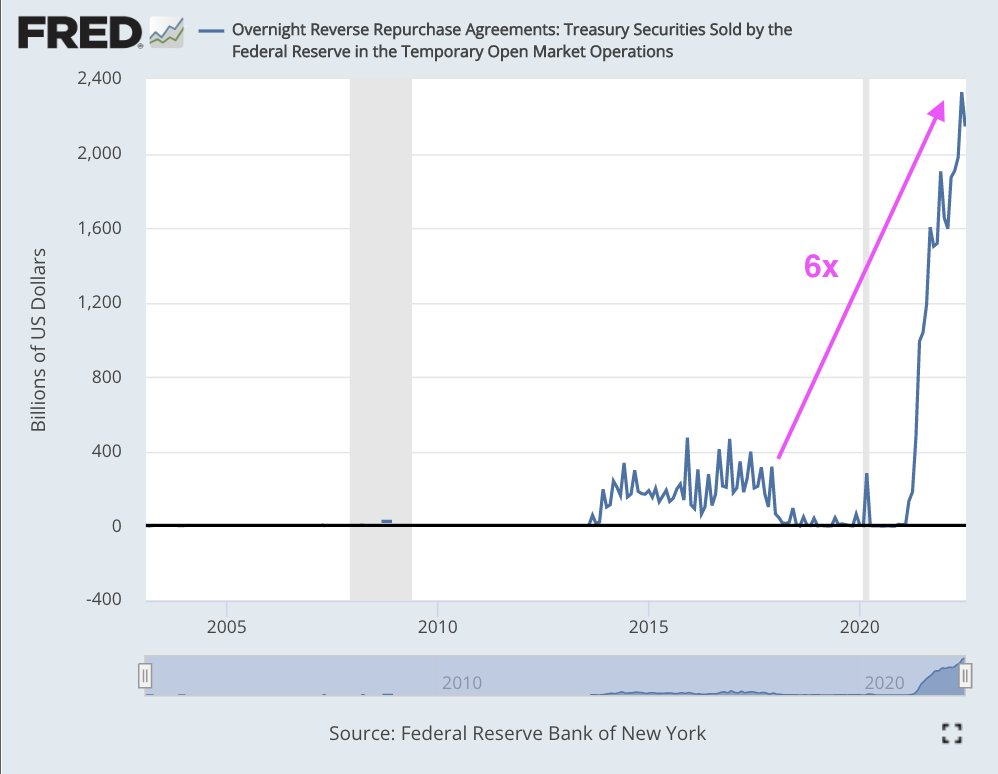
- The Fed raises rates on Reverse Repo, providing a better alternative for low-duration-risk.
Outcome?
Sucking in over $2 trillion in liquidity, Reverse Repo created a situation where six times more money was unavailable to circulate in the economy than ever before.
Let’s deconstruct the above:
The fun begins when you start thinking about it in the context of the “Net Liquidity”, which, in simple terms, is the amount of money available to circulate in the economy.
The formula for calculating it goes something like this:
Net Liquidity = Size of the Fed's Balance Sheet - Funds Sucked into Treasury (TGA) - Funds Sucked in Reverse Repo Click To Tweet (RRP)
Back to what’s the catch
In past cycles, the size of the Fed’s balance sheet changed a lot, while TGA and RRP changed relatively little. So the size of the balance sheet roughly equated to Net Liquidity. TGA and RRP didn’t matter. They were rounding errors by comparison.
But starting in 2020, the Fed’s balance sheet size has been x3 than the relative changes in TGA and RRP. This change in 2020 has made the Treasury and Reverse Repo two main forces driving the actual Net Liquidity in the market.
Correlation between Net Liquidity and S&P500
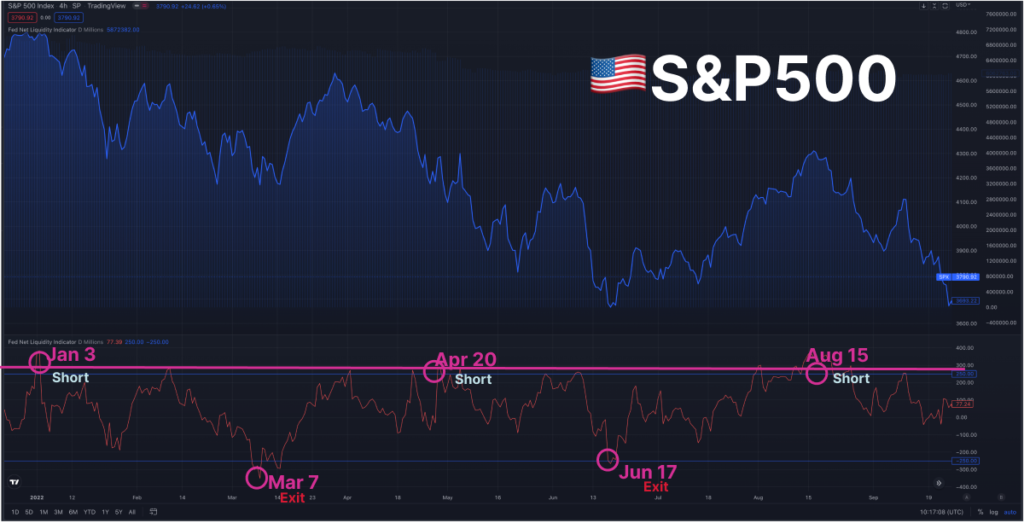
Below is the chart showing the correlation between Net Liquidity and S&P500 as offset backward with two weeks delay (now it’s shorter, some claim it is due to the market having caught up with this indicator).
What the graph shows is that changes in Net Liquidity inversely indicate the direction of the SP500 over the next two weeks (or less nowadays, as indicated earlier).
The original assumption is that the change in asset composition on FED’s balance sheet take two weeks to take effect.
How the changes in Net Liquidity to Predict the Direction of S&P500?
The claim here is that a fair value of $SPX is determined by net liquidity, or, in other words, its mean reversion target.
While not guaranteed, the method has shown to be working for some on FinTwit, which we know is as reliable as Wikipedia, but we still believe that this approach to measuring the Net Liquidity, as well as the importance of keeping Net Liquidity in mind while trading Indices related to the global economy, has its merits.
This being said, it’s crucial to keep in mind that other factors such as sentiment, positioning, and world events can cause extreme temporary deviations from this level.
Manually determining the direction of SP500 Based on changes in Net Liquidity
- Track changes in the FED’s balance sheet. Updated weekly at 16:00 ET each Friday
- Track Treasury General Account. Updated daily at 16:00 ET each day
- Follow Reverse Repo daily at 15:00 ET
- On Market open, enter and close an SPX (S&P500) trade respectively when a previous day close shows:
- Fair Value reaches extreme levels of overvaluation (>350), or returns back (<150)
- Fair Value = (Fed Bal Sheet – TGA – RRP)/1.1 – 1625 where
- 1.1 = scaling coefficient
- -1625 = offset
The offset values and scaling coefficients are indicative and can/may need to be adjusted, but the core concept behind the idea remains the same. Also, it applies only to the Bear, post-2020 market, so no backtesting should provide you with additional insight into the approach.
Using the TradingView indicator to determine the direction of SP500 Based on changes in Net Liquidity,
- Go to TradingView.com
- Open SXP or SPY Graph and look for “Fed Net Liquidity Indicator”
- Make sure the Y scale does not have the button checked for “Auto (fits data to screen)” – this will make sure that you can pan around the prices and scales.
- Drag around both the Y scales and the plot itself so that you can put the SPX /SPY price over the blue indicator.
Alternatively, download the script or ask the creator about the applicability in the comments section.
To Wrap It Up
- There is an alleged method to trade SPX (S&P500) based on the concept of “Net Liquidity,” correlation
- Determining Net Liquidity has changed since 2020 (COVID relief package), hence;
- Calculate Net Liquidity taking into account Reverse Repo & Treasuries
- Determine S&P500 “Fair Value” manually or via a Tradingview indicator (derived from Net Liquidity) to open and close trades
- Enter when the previous day closes at >350
- Close when the previous day closes <150
Safe Trading
Team of Elite CurrenSea 🇺🇦❤️


Leave a Reply