🎯 EUR/USD Bullish ABC Zigzag Aims at H&S Target 🎯
Dear traders,
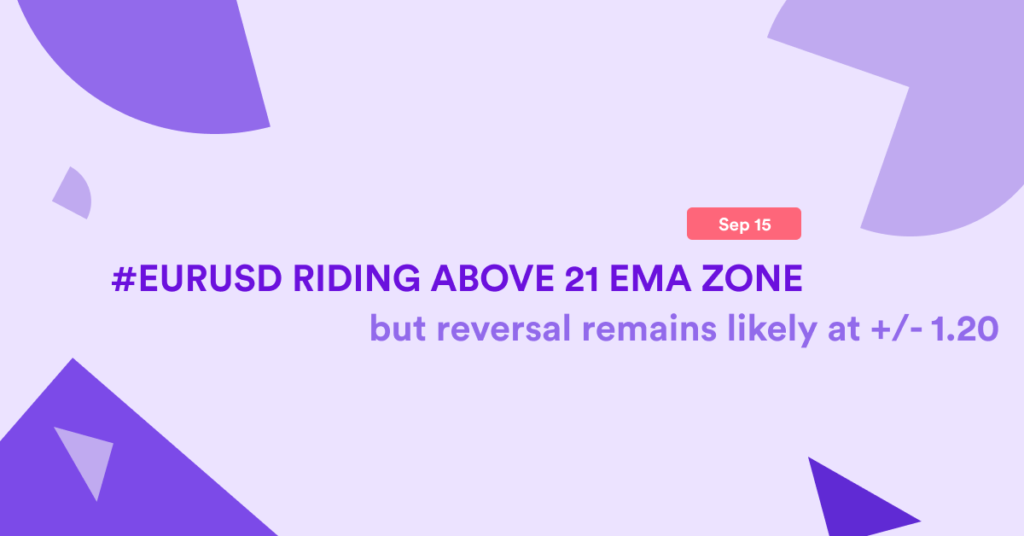
the EUR/USD made a bullish break and bounced at the 21 ema zone. The bulls are back in control. But how far can they push before a target is hit? And the bears create a reversal anytime soon? Let’s review this in today’s wave analysis on the EUR/USD.
Price Charts and Technical Analysis
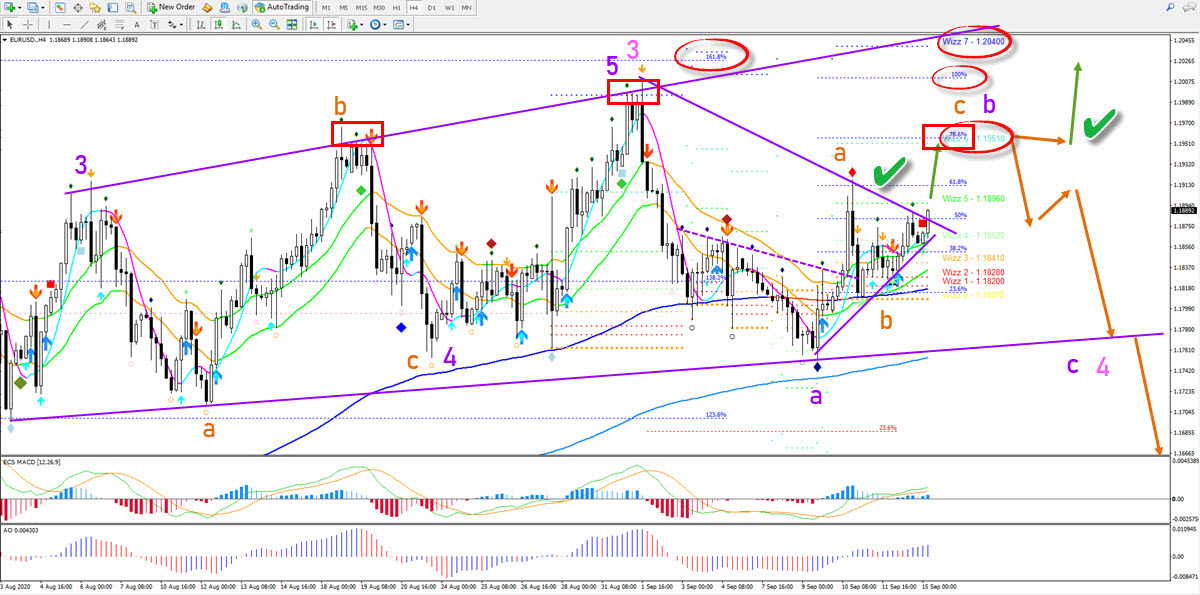
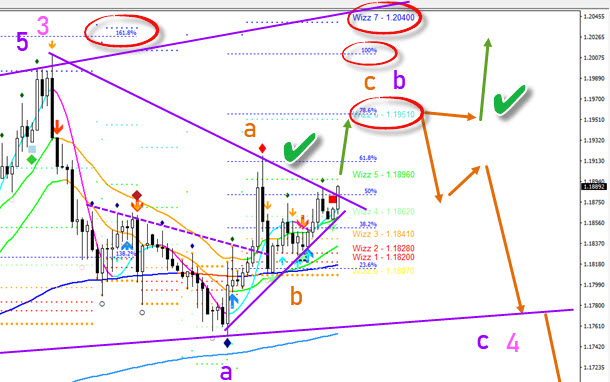
The EUR/USD is building a bullish ABC (orange) pattern. A bullish breakout above the resistance trend line (purple) is therefore likely. The first target (red circle) is the Wizz 6 level and the 78.6% Fibonacci retracement level at 1.1960. If price action responds with a bull flag chart pattern, then a continuation higher will take price to the 2nd target zone at 1.20-1.2050 where traders can see a confluence of 161.8% Fibonacci target, 100% Fib target, and Wizz 7 level.
However, a strong bearish price action signal at the first target could indicate a reversal. Helping the turn around is the potential head and shoulders reversal chart pattern (red boxes). This confirmation becomes stronger especially if price action makes a lower high and lower low. In that case, a 5 wave pattern is expected within the wave C (purple) of wave 4 (pink) and price action could build a serious retracement. Only a break above the Wizz 7 level would clearly confirm the uptrend.
The analysis has been done with the indicators and template from the SWAT method (simple wave analysis and trading). For more daily technical and wave analysis and updates, sign-up to our newsletter.
Good trading,
Chris Svorcik


Leave a Reply