🔥 DJI 30 Price Swings and Waves Before US Elections 🔥
Dear traders,
the Dow Jones Index (DJI 30) tested the previous top… but price action was unable to break it.
This article reviews the potential ABC (orange) correction and how deep the retracement can go with the U.S. Presidential elections around the corner.
Price Charts and Technical Analysis
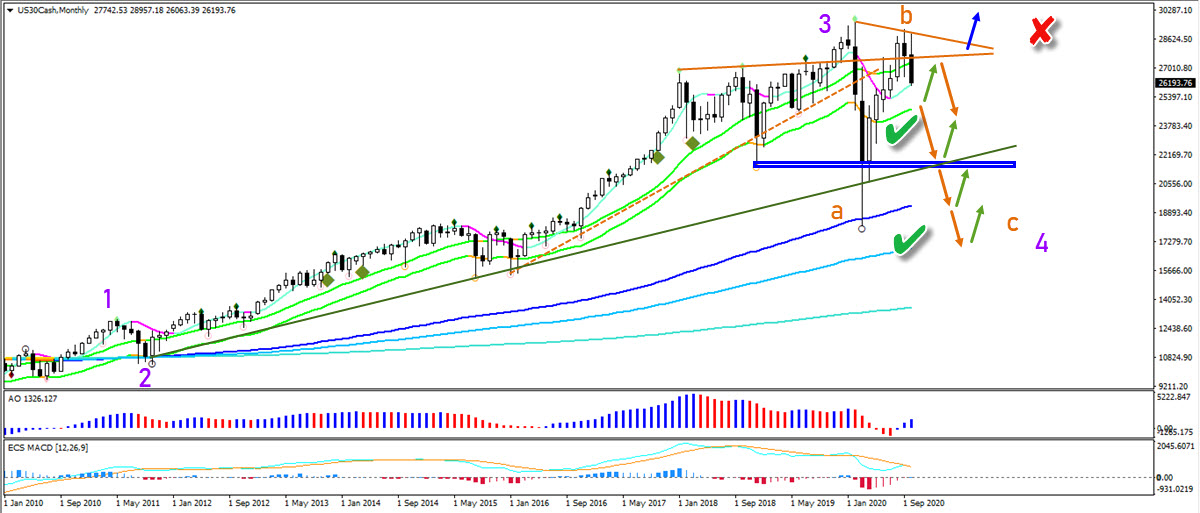
DJI 30 is showing two bearish monthly candles in a row. This could confirm a bearish bounce. Plus the end of the wave B (orange).
The start of the wave C (orange) is confirmed once price action is able to break below (orange arrow) the 21 ema zone. The first target is the support zone (blue box).
A second bearish breakout could indicate an even deeper retracement towards the previous bottom and long-term moving averages. Only a break (blue arrow) above the resistance invalidates (red x) the bearish ABC pattern.
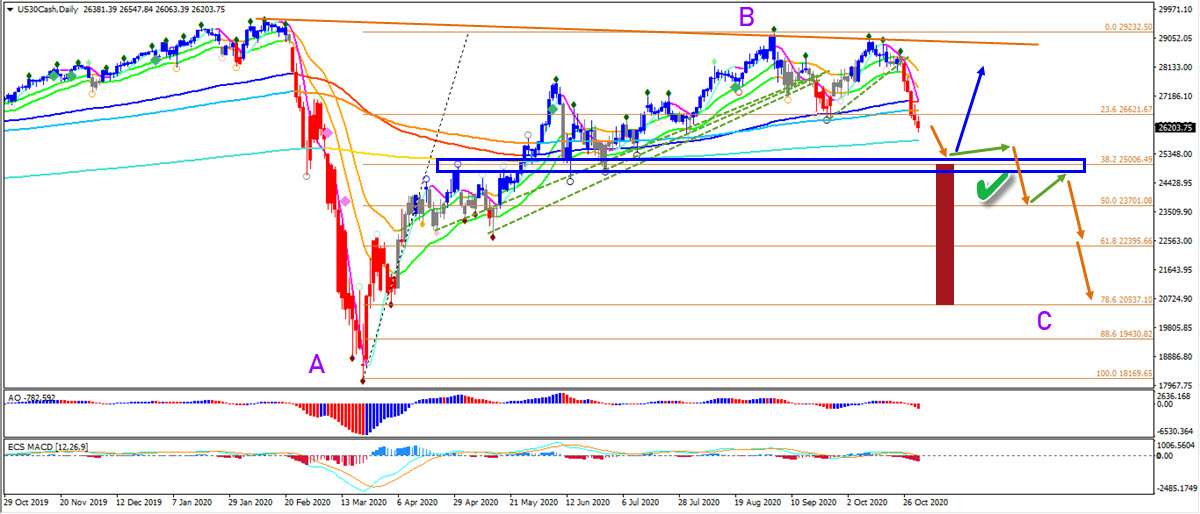
On the daily chart, price action is still above the shallow 38.2% Fibonacci retracement level. This means that bears should still be very careful of this Fib and the support zone.
A strong bullish bounce (blue arrow) could confirm the uptrend. A bear flag (green arrow) could indicate more downside.
Once price breaks below the 38.2% Fib (green check), then there is substantial bearish space (red box) for a significant move lower towards the 78.6% Fib.
The analysis has been done with the indicators and template from the SWAT method (simple wave analysis and trading). For more daily technical and wave analysis and updates, sign-up to our newsletter.
Good trading,
Chris Svorcik


Leave a Reply