🏁 GBP/AUD Bullish Momentum Patterns Aiming for 1.85 Target 🏁

Dear traders,
the GBP/AUD bulls are breaking above the resistance trend line (dotted purple line). Price action seems to have completed a wave 4 (purple) pattern. Price is now preparing for a target at 1.85. How could traders profit from this expected price movement?
Price Charts and Technical Analysis
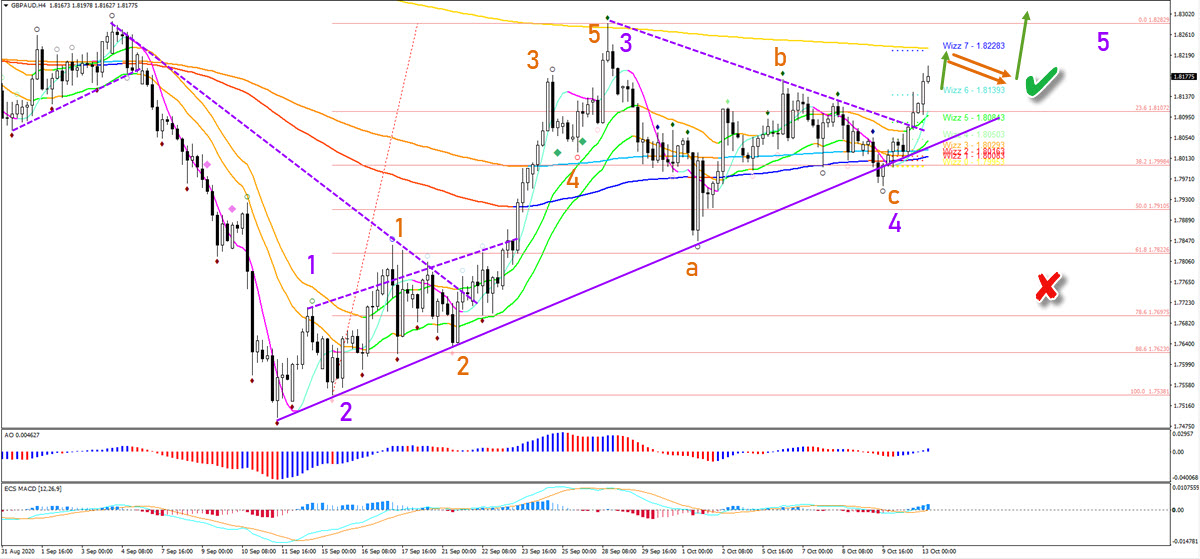
The GBP/AUD will probably build a bull flag chart pattern on the 4 hour chart (orange arrows). The main candidate is the resistance zone around 1.8225-50 due to the long-term moving averages, previous tops, and Wizz 7 level.
A break above the flag could confirm the bullish continuation within wave 5 (purple). Whereas only a break below the 61.8% Fib invalidates (red x) this wave pattern and outlook.
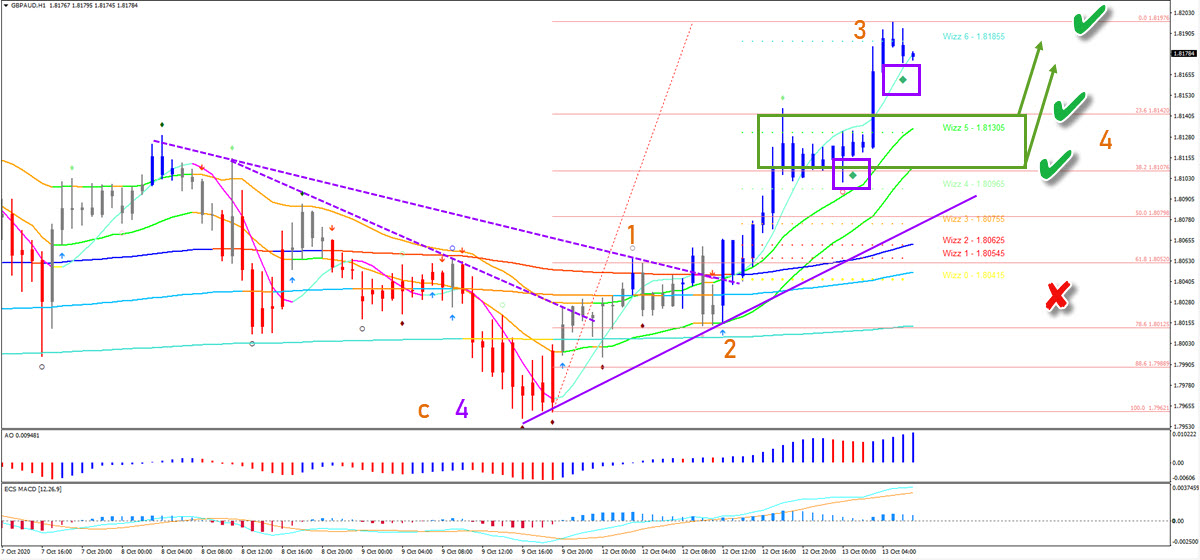
On the 1 hour chart, the GBP/AUD is showing strong bullish momentum (green diamonds). Price action is probably completing a wave 3 and any potential pullback could be a wave 4 (orange).
This remains valid as long as price action stays above the 61.8% Fib (red x) at 1.8050. The support zone and the Fibonacci retracement levels are two main candidates for a bullish bounce.
The analysis has been done with the indicators and template from the SWAT method (simple wave analysis and trading). For more daily technical and wave analysis and updates, sign-up to our newsletter.
Good trading,
Chris Svorcik


Leave a Reply