❗️ Bitcoin (BTC/USD) Remains Bullish Despite H&S Reversal Pattern ❗️

Dear Traders,
Bitcoin (BTC/USD) made a bullish bounce at the 38.2% Fibonacci retracement support level. Is it time for a continuation of the uptrend or will the pattern expand into a complex correction?
Price Charts and Technical Analysis
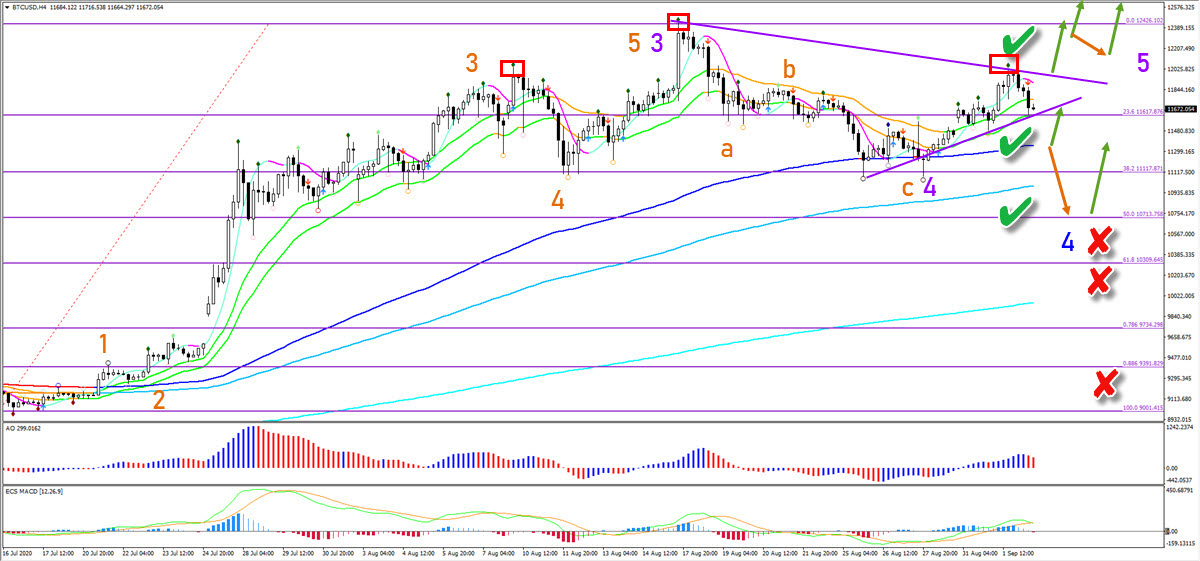
The BTC/USD remains in a strong uptrend. The long-term moving averages have a bullish angle and are all aligned to the upside. The bullish bounce at the 38.2% Fibonacci level could indicate the end of a wave 4 (purple). But price action would need to bounce at the 144 ema or break above the resistance trend line. A bullish continuation is then expected to develop soon.
A break below the 144 ema could indicate an expanded wave 4 (blue) at a new low. In that case the head and shoulders pattern (red boxes) could push the price lower. The 50% Fibonacci level is another support zone. Only a break below the 50% Fib and other Fibs would make the bullish outlook less likely (red x). The wave 4 can also turn into a contracting triangle, which would mean another wave C, D, and E before the uptrend continues. The -27.2% target is at 13,350 and the -61.8% Fib target is at 14,500.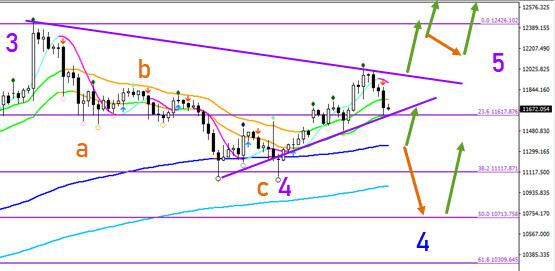
The analysis has been done with the indicators and template from the SWAT method (simple wave analysis and trading). For more daily technical and wave analysis and updates, sign-up to our newsletter.
Good trading,
Chris Svorcik
Elite CurrenSea


Leave a Reply