Financial Markets Weekly Performance Analysis vs Portfolio Flagship September 4-8 ’23


In this week’s analysis, we are going to discuss the following markets
- Indices – S&P, Nasdaq, FTSE 100, DAX
- Cryptos – BTC, ETH, BNB
- Commodities – Gold, Silver
- Forex majors – EURUSD, GBPUSD, USDJPY
Indices in Flux: Nasdaq vs. S&P – Winners and Losers Revealed! Indices Market for 04 – 08 Sep. 2023
Major stock market indices saw declines this week due to various fundamental reasons. German car manufacturers faced a drop in orders, and the British Pound (GBP) showed a bearish trend. Additionally, several European and US indicators pointed to weakness in the equity markets.
USA Indices
Nasdaq Composite
In the USA, the Nasdaq Composite index didn’t perform as well as the S&P 500. The ISM Non-Manufacturing PMI for August was positive at 54.5, surpassing expectations and the previous reading of 52.7. However, this had a limited impact on the Nasdaq, which is more tech-focused, compared to the broader S&P 500. The ISM Non-Manufacturing Prices for August indicated higher inflationary pressures, which are generally bearish for both the Nasdaq and S&P.
On a positive note, Initial Jobless Claims decreased to 216k from the previous 229k, which had an overall positive effect. Factory Orders for July also declined by -2.1%, which is bearish for tech companies in the US. Crude oil inventories exceeded expectations at 6.3M, signaling lower energy demand and a potential economic slowdown, which negatively affected tech-heavy firms.
Amid an escalating trade dispute between China and the USA, some US companies suffered. China’s actions against Apple caused the tech giant to lose significant value quickly, impacting both the Nasdaq and S&P indexes.
Overall, the Nasdaq was in bearish territory because of the majority of indicators being bearish for the tech-heavy index.
Regarding tech stocks’ performance last week, Apple dropped nearly 6%, from 188 to 177.5 USD. Nvidia fell by 4.1%, going from 482 to 462 USD, while Tesla saw a modest 2.6% increase, rising from 245 to 251 USD. Overall, most stocks within the Nasdaq experienced losses.
The S&P 500
The S&P 500 index experienced a minor 1.3% decline due to several fundamental factors. The S&P Global Services PMI for August was lower than expected, suggesting a slowdown in the US services sector. However, the positive ISM Non-Manufacturing PMI softened the decline, as many macroeconomic factors affect both the S&P and Nasdaq due to their common constituent companies.
In terms of individual stock performance within the S&P 500, Meta platforms showed gains of 0.55%, going from 297 to 298 USD, while Microsoft saw marginal gains of 0.27%, rising from 329 to 329.9 USD. Google experienced a slight decrease of 0.17%, going from 136.4 to 136.2 USD.
EU and UK indices
FTSE 100
Moving to the EU and UK indices, the FTSE 100 index faced challenges in the UK housing market, with both the Halifax House Price index on a monthly and yearly basis showing bearish trends. Mortgage rates also increased. Surprisingly, the BRC retail sales monitor indicated bullish readings.
In the FTSE 100, most stocks saw losses during the past week, with Lloyds Banking Group falling by almost 3%, Barclays PLC losing 1.62% of its value, and Vodafone Group slipping by 0.24%. However, Centrica plc gained around 4%, and BP rose by 1.6%.
DAX
In Germany, the CPI for August remained stable, but the German car industry faced a sharp decline in production orders. German industrial production improved slightly but remained bearish.
Top stocks in the German Stock Market Index had mixed results, with Siemens losing 4.6%, Mercedes-Benz Group dropping 0.86%, Airbus rising by 2.3%, and Deutsche Telekom also showing a 1.3% increase.
The Eurozone experienced bearish news, including reduced year-over-year GDP growth and lower-than-expected quarter-over-quarter GDP growth for Q2, ultimately leading to a 0.8% decline in DAX value.
Indices technical weekly performance numbers (USD)
| Monday Open Price | Friday Open Price | % Change | |
| S&P500 | 4,510.06 | 4,451.14 | -1.3 |
| Nasdaq Composite | 13,994.54 | 13,748.83 | -1.76 |
| FTSE 100 | 7,452.76 | 7,450.68 | -0.028 |
| DAX | 15,904.63 | 15,777.56 | -0.8 |
Crypto Comeback: Major Coins Surge Amidst Market Turmoil! Crypto Markets for 04 – 08 Sep. 2023
After a downbeat week, the current week brought some relief to the cryptocurrency market, with all major cryptocurrencies seeing moderate gains. However, it’s important to note that the crypto market is still facing a bearish trend and remains well below its previous peak values.
Bitcoin’s dominance in the market has fallen to 48.57%, and its trading volume is declining. Despite this overall bearish sentiment, Bitcoin managed to rise by 1%, Ethereum (ETH) gained 0.67%, and Binance Coin (BNB) saw a 1.22% increase.
BTC
Both the G20 and the IMF agreed that an outright ban on all cryptocurrencies would not be a wise long-term move. Instead, they advocated for targeted regulations and a sensible monetary approach. This shift in tone reduced the negative pressure on major cryptocurrencies, resulting in a modest 1% increase in Bitcoin’s value. However, it’s worth noting that Bitcoin is still trading below its recent high of 29k.
ETH
In the previous week, Ethereum’s founder, Vitalik Buterin, began selling ETH on exchanges, which added to the challenges of ETH’s recovery. Consequently, Ethereum only managed to achieve a minimal 0.67% gain. No significant positive news emerged for the world’s second-largest cryptocurrency project during the week, which counterbalanced the negative impact of its founder’s actions.
BNB
Binance, the company behind Binance Coin, continued its strong performance by expanding into new markets and introducing new products. Binance made a significant move by reducing its presence in Russia, aligning with the global community’s stance on the country’s aggressive actions. Additionally, BNB’s strength lies in its role within the Binance exchange, where it is known for stability and a strong track record compared to other major cryptocurrencies.
Crypto technical weekly performance numbers (USD)
| Asset | Monday Open Price | Friday Open Price | % Change |
| BTC | 25,968.17 | 26,238.87 | 1.04 |
| ETH | 1,635.72 | 1,646.67 | 0.67 |
| BNB | 214.39 | 217 | 1.22 |
Commodity Crunch: Gold and Silver Slide as USD Gains Strength! Gold and Silver for 04 – 08 Sep. 2023
Precious metals had a tough week due to the strong performance of the US dollar in the Forex markets. This is a common occurrence because precious metals tend to move in the opposite direction to the dollar. When the dollar is strong, it tends to weaken the prices of precious metals, and vice versa.
Gold-positive PMI readings and lower jobless claims are generally negative for precious metals like gold. This is because a stronger US dollar becomes more attractive to investors, shifting their focus away from safe-haven assets like gold. This week, the US dollar gained strength against major currencies such as the Euro (EUR), British Pound (GBP), and Japanese Yen (JPY). This put the dollar in a bullish position, impacting safe-haven assets like gold and silver.
Silver
Silver tends to have more pronounced price movements compared to gold. When gold goes down, silver often drops even more, and when gold rises, silver can see even greater gains. This week, the strong US dollar exerted downward pressure on precious metals, leading to a 5% loss in the price of silver.
Commodities technical weekly performance numbers (USD)
| Monday Open Price | Friday Open Price | % Change | |
| Gold | 1,941.33 | 1,920.13 | -1.09 |
| Silver | 24.1752 | 22.9532 | -5.05 |
Forex Fireworks: USD Dominates, GBP Struggles, JPY Slides! Forex Market for 04 – 08 Sep. 2023
The US dollar stood stronger compared to other major currencies, driven by several positive factors from the USA, while the Eurozone displayed some minor weaknesses. The German Consumer Price Index (CPI) remained unchanged, and the Eurozone had a bearish tone. In contrast, the Initial Jobless Claims in the USA significantly contributed to the strength of the US dollar. However, it’s important to note that the dollar wasn’t overwhelmingly stronger than other currencies, with EUR/USD declining by 0.69%, GBP/USD by 0.93%, and USD/JPY seeing a slight increase of 0.83%.
EUR/USD
The US dollar gained ground against the Euro due to several bullish indicators. While German CPI remained steady, Eurozone GDP showed bearish trends. In contrast, the US had numerous positive releases, including the ISM Non-Manufacturing PMI and prices, along with the encouraging initial jobless claims data. These factors made the US dollar more attractive to investors. Among the various economic indicators that can influence the Forex market, Initial Jobless Claims are particularly impactful, and their bullish effect on the US dollar should not be underestimated.
GBP/USD
For the British pound, the retail sales monitor displayed a positive trend. However, the S&P Global/CIPS UK Composite PMI indicated a decline to 48.6 from the previous month’s 50.8, and the services PMI also showed bearish tendencies at 49.5, down from the previous 51.5. Despite the optimistic retail sales data, the lower composite PMI suggested a slowdown in the UK economy, with a similar bearish tone seen in the services PMI.
USD/JPY
The Japanese yen slightly depreciated against the US dollar as the Gross Domestic Product (GDP) for Q2 came in lower than expected but still higher than the previous reading of 0.8%. This mild bearish pressure wasn’t sufficient to push the yen down by more than 0.83%. While GDP has a more pronounced impact on the yen, minor news events also had a slight bearish effect on the Japanese currency, with household spending at -5.0%, worse than the previous figure of 4.2%. Consequently, USD/JPY declined by 0.83%.
Forex technical weekly performance numbers (USD)
| Monday Open Price | Friday Open Price | % Change | |
| EUR/USD | 1.0776 | 1.0702 | -0.69 |
| GBP/USD | 1.2591 | 1.2474 | -0.93 |
| USD/JPY | 146.057 | 147.274 | 0.83 |
Performance Comparison Chart of $1000 investment
How much money would you make or lose last week if you were to invest $1000 in each of the sectors discussed above?
Let’s pick the winning asset from each sector and compare its performance with the flagship automated trading system from Elite CurrenSea. Elite CurrenSea offers a wide range of trading systems and portfolio management solutions, and Portfolio Flagship is its current bestseller. The robot has been tested on real markets and has shown remarkable results every single week.
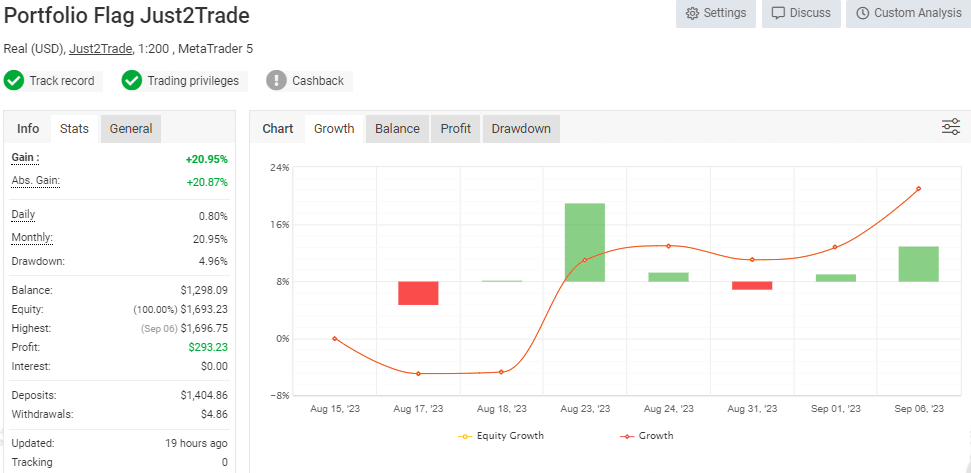
Portfolio Flagship Trading System Live Results for 04 – 08 Sep. 2023
The Flagship was a solid performer with 4% gains in 5 days, which is beyond fantastic for any trading system.
Let’s see the $1000 investment potential results for the past week.
| Portfolio Flagship | Cryptos | Forex | Indices | Commodities | |
| Growth | 4% | 1.22% | 0.83% | -0.9% | -1% |
| PnL on $1000 | $40 | $12.2 | $8.3 | -$9 | -$10 |
As we can see, Portfolio Flagship showed a profit of 4% in a single week! Cryptos were in second place with 1.22% gains. The one tendency readers would have noticed is how stable the Portfolio Flagship system is when it comes to performance. Every single week, while other assets are showing mixed results, the automated system shows persistent gains.
Safe Trading
Team of Elite CurrenSea
Flagship


Leave a Reply