Financial Markets Weekly Performance Analysis vs Portfolio Flagship August 14-18 ’23


In this week’s analysis, we are going to discuss the following markets
- Indices – S&P, Nasdaq, FTSE 100, DAX
- Cryptos – BTC, ETH, BNB
- Commodities – Gold, Silver
- Forex majors – EUR/USD, GBP/USD, USD/JPY
Indices Meltdown: S&P, Nasdaq, FTSE 100, and DAX Take a Hit For 14 – 18 Aug 2023
Indexes in the stock market saw a consistent drop last week. The London stock index had the biggest fall, going down by 2.22%. The Nasdaq Composite, which is focused on tech companies, also experienced losses of about 2%. Other indexes, like the S&P 500, also went down by almost 2%. The German DAX showed more resilience, with only a 0.9% decrease. Now, let’s take a closer look at what happened from August 14th to 18th.
USA Indices
Nasdaq Composite
The Nasdaq Composite, heavily influenced by technology companies, took a hit due to higher interest rates. After the release of the FED meeting minutes, which hinted at more interest rate hikes, the Nasdaq suffered. Additionally, lower building permits in July indicated a possible slowdown in construction, which is not good for the economy or stock markets. The NY Empire State Manufacturing Index for August was much worse than expected, indicating manufacturing issues in New York and potential problems for the broader economy.
Among the Nasdaq’s component stocks, Apple dropped by 2.2% from 177 to 174, Nvidia rose by 7% from 404 to 433, and Tesla fell by almost 7% from 235 to 219 USD. Overall, tech stocks had a bearish week.
The S&P 500
The key news this week was from the Fed meeting minutes, which suggested that more interest rate hikes could happen to counter inflation concerns. Combined with Treasury yields reaching their highest levels since 2022, this uncertainty affected the equity markets. Higher interest rates mean higher borrowing costs for companies, leading to reduced loans. Investors started favoring bonds due to their higher yields, affecting stock markets negatively. This led to three consecutive days of losses for the S&P. If yields keep rising, stock markets might continue to be impacted.
Regarding individual stocks within the S&P 500, Microsoft declined by 1.4% from 321 to 316, Amazon fell by 3.1% from 138 to 133, Google went up by 0.5% from 129 to 130, and Meta Platforms dropped by nearly 5% from 300 to 285.
EU and UK indices
FTSE 100
The FTSE 100 index went down due to various reasons. Retail sales decreased, and investors were anticipating interest rate hikes. This affected the London stock index negatively. Additionally, the UK’s unemployment rate increased to 4.2%, Core Retail Sales on a Year-over-Year basis decreased to -3.4%, and Month-over-Month retail sales dropped to -1.4%. These factors led to a decline in stock markets, indicating reduced consumer spending and lower earnings for companies listed on the London Stock Exchange.
Rolls-Royce Holdings fell sharply by almost 4% from 208 to 200, BP declined from 484 to 472, Vodafone Group lost 2.24% going from 72 to 70, Barclays PLC went down from 146 to 144, and Lloyds Banking Group slid from 42.81 to 42.25, a slight 1.3% decrease.
DAX
The German DAX index experienced a drop of nearly 1% due to bearish economic sentiment. The German ZEW current conditions and economic sentiment readings were both negative, suggesting a deterioration in the German economy. The EUR ZEW Economic Sentiment for August signaled worsening economic sentiment in the Eurozone, impacting investor confidence in European markets. This news could affect not only the DAX but also the Nasdaq and S&P indexes. The EUR Core CPI for July showed an expected 5.5% reading, further reinforcing the bearish outlook in the Eurozone. The Year-over-Year GDP declined from 1.1% to 0.6% in Europe.
The German stock exchange index showed more resilience to bearish news for two consecutive weeks compared to other major indexes, making it more appealing to investors. This trend was also evident in DAX constituent stocks. Airbus stock price declined by 2.25% from 130 to 127, Mercedes-Benz Group dropped from 68 to 67, Siemens experienced a bearish movement from 13.71 to 13.45, and SAP fell from 125 to 123.
Indices technical weekly performance numbers (USD)
| Monday Open Price | Friday Open Price | % Change | |
| S&P500 | 4,458.13 | 4,370.36 | -1.97 |
| Nasdaq Composite | 13,599.00 | 13,316.93 | -2.07 |
| FTSE 100 | 7,524.16 | 7,356.88 | -2.22 |
| DAX | 15,818.21 | 15,676.90 | -0.89 |
Crypto Chaos: G20’s Crypto Crackdown Sends Bitcoin, Ethereum, and BNB Plummeting! 14 – 18 Aug 2023
The G20, represented by India, recently unveiled a crypto regulatory plan that struck fear into crypto investors, causing significant drops in major crypto prices. This unsettling development also reflected in the fear and greed index, showing a shift towards fear among crypto investors.
BTC
The G20’s impending crackdown on the crypto market has sent shockwaves. India, currently holding the G20 presidency and known for its anti-crypto stance, released a roadmap for global crypto regulations. This major announcement led to a 9% decline in BTC prices. While substantial, this drop isn’t catastrophic for cryptocurrencies. Additionally, the anticipation of higher interest rates in the US suggests reduced capital for crypto investments, as borrowing costs rise and risky assets like cryptos become less attractive.
ETH
ETH followed BTC’s lead and experienced an 8.46% decline. The impact was somewhat cushioned as BTC holds greater popularity in India and globally. The entrance of BlackRock into the Indian market with Bitcoin futures had a limited impact on ETH, which is less favored in India. The ETH development team remains focused, and aside from global political events, there were no significant bullish or bearish updates.
BNB
G20’s extensive crypto crackdown affected BNB, which typically shows resilience compared to other cryptocurrencies. Consequently, BNB dropped by over 9%, slightly exceeding BTC’s decline. The crypto fear and greed index, indicating investor sentiment towards digital currencies, currently stands at 37, reflecting a fearful outlook among crypto investors.
Crypto technical weekly performance numbers (USD)
| Asset | Monday Open Price | Friday Open Price | % Change |
| BTC | 29,283.26 | 26,643.09 | -9.02 |
| ETH | 1,839.32 | 1,683.70 | -8.46 |
| BNB | 240.04 | 218.21 | -9.09 |
Gold Dips, Silver stable as Strong Dollar and Fed’s Rate Hike Signals Loom for 14 – 18 Aug 2023
Precious metals are influenced by several key factors, such as macroeconomic indicators, market sentiment, geopolitical events, and global economic conditions. These metals are often sought as safe havens during times of economic uncertainty and a weaker dollar. However, this week presented a different scenario as the USD strengthened, and the Fed hinted at potential interest rate hikes, prompting investors to reconsider their investment strategies. Silver demonstrated limited movement, while gold experienced a minor decrease due to reduced demand for safe-haven assets.
Gold
The primary precious metal saw a 1.17% decline, influenced by various elements. The USD’s strength, driven by positive economic reports and the possibility of interest rate hikes, played a significant role. A robust USD tends to make gold less appealing, as investors shift away from safe-haven assets. Elevated treasury yields and market uncertainty led investors to recalibrate their portfolios, impacting the demand for gold negatively.
Silver
Silver exhibited a modest 0.15% increase, reflecting similar sentiments with a lesser impact. The metal was showing a sideways trend and ended a week with slightly positive returns.
Commodities technical weekly performance numbers (USD)
| Monday Open Price | Friday Open Price | % Change | |
| Gold | 1,913.67 | 1,891.29 | -1.17 |
| Silver | 22.6772 | 22.7112 | 0.15 |
Forex: USD Dominates, GBP Holds Steady, and USDJPY Rises for 14 – 18 Aug 2023
Positive economic developments in the USA led to a strengthening of the USD against the EUR and JPY, while the GBP held its position due to favorable news from the UK. The Euro weakened due to a series of negative reports from the Eurozone, including deteriorating EUR ZEW Economic Sentiment (August), German ZEW current conditions, and economic sentiment. Anticipations of further interest rate hikes in the US resulted in a 0.65% decline in the EURUSD pair. GBPUSD saw modest gains due to an array of positive news from the UK, while USDJPY experienced a 0.68% increase, showing lesser influence from optimistic Japanese news.
EUR/USD
The USD displayed strength this week owing to optimistic economic news associated with the global reserve currency. The release of FOMC Meeting Minutes led investors to anticipate additional interest rate increases aimed at curbing inflation, contributing to a bullish outlook for the USD. Furthermore, initial jobless claims came in below expectations, further bolstering the dollar’s value against other currencies.
GBP/USD
Although the dollar gained ground against the EUR and JPY, the situation was different for GBP. The UK’s Consumer Price Index (CPI) for July met expectations at 6.8%, which was lower than the previous 7.9%, indicating reduced perceived inflation for the GBP. Additionally, bearish crude oil inventory figures for the USD, along with lower-than-expected data from the USA, supported GBP’s rise against the dollar. Declining building permits in the US further favored the GBP, resulting in a modest 0.41% increase in GBPUSD.
USD/JPY
Despite a robust GDP growth rate of 1% for Q2, surpassing expectations of -0.3% and the previous 0.2%, the Japanese Yen couldn’t appreciate against the dollar. This unexpected positive performance helped limit the yen’s loss to only 0.68% against the dollar. The yen’s stability was evident through consistent inflation data, unchanged interest rates by the Bank of Japan (BOJ), and positive GDP figures, all contributing to investor confidence in a major Asian currency.
Forex technical weekly performance numbers (USD)
| Monday Open Price | Friday Open Price | % Change | |
| EURUSD | 1.0944 | 1.0873 | -0.65 |
| GBPUSD | 1.2695 | 1.2747 | 0.41 |
| USDJPY | 144.817 | 145.797 | 0.68 |
Performance Comparison Chart of $1000 investment
How much money would you make or lose last week if you were to invest $1000 in each of the sectors discussed above?
Let’s pick the winning asset from each sector and compare its performance with the flagship automated trading system from Elite CurrenSea. Elite CurrenSea offers a wide range of trading systems and portfolio management solutions, and Portfolio Flagship is its current bestseller. The Flagship has been tested on real markets.
Portfolio Flagship Trading System Live Results For 14 – 18 Aug 2023
The primary trading system from Elite CurrenSea is called the Portfolio Flagship and is a solid performer so far with 1.5% gains in 5 days.
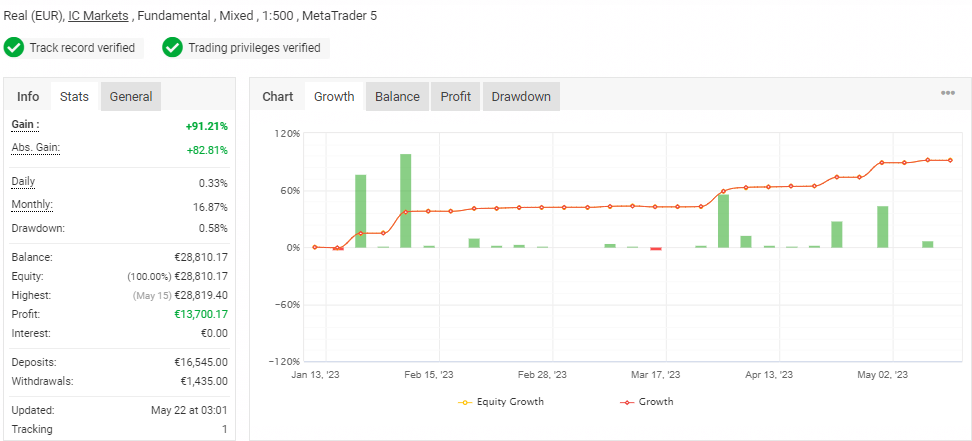
Let’s see the $1000 investment potential results for the past week.
| Portfolio Flagship | Forex | Commodities | indices | Cryptos | |
| Growth | 1.5% | 0.68% | 0.15% | -0.89% | -8.46% |
| PnL on $1000 | $15 | $6.8 | $1.5 | -$8.9 | -$84.6 |
As we can see, Portfolio Flagship was on the 1st place by consistent returns, and Forex was on the 2nd with half the performance of the past week. Silver would make 0.15% and indices, and cryptos would lose money. Every single week, while other assets are showing mixed results, both automated systems show persistent gains.
Safe Trading
Team of Elite CurrenSea
Flagship


Leave a Reply