Navigating the August Anomalies: From S&P 500 to Fed Policy and Beyond

As the dog days of August come to a close, a range of financial developments—from the S&P 500’s volatility to new shifts in global economic policy—have investors scratching their heads. In this comprehensive blog post, we dissect the events that have dominated financial news this month.
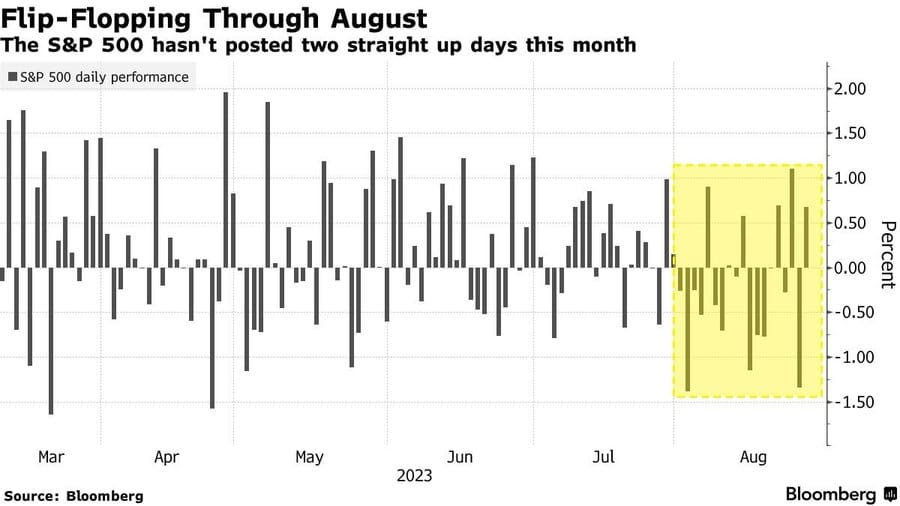
August Angst: The S&P 500’s Struggle for Consistency
The S&P 500 index has grappled with volatility throughout August 2023. Notably, it has failed to record back-to-back gains this month. Should this pattern persist through the end of Friday, it will be the first month since 2010 where the index hasn’t seen two consecutive positive sessions.
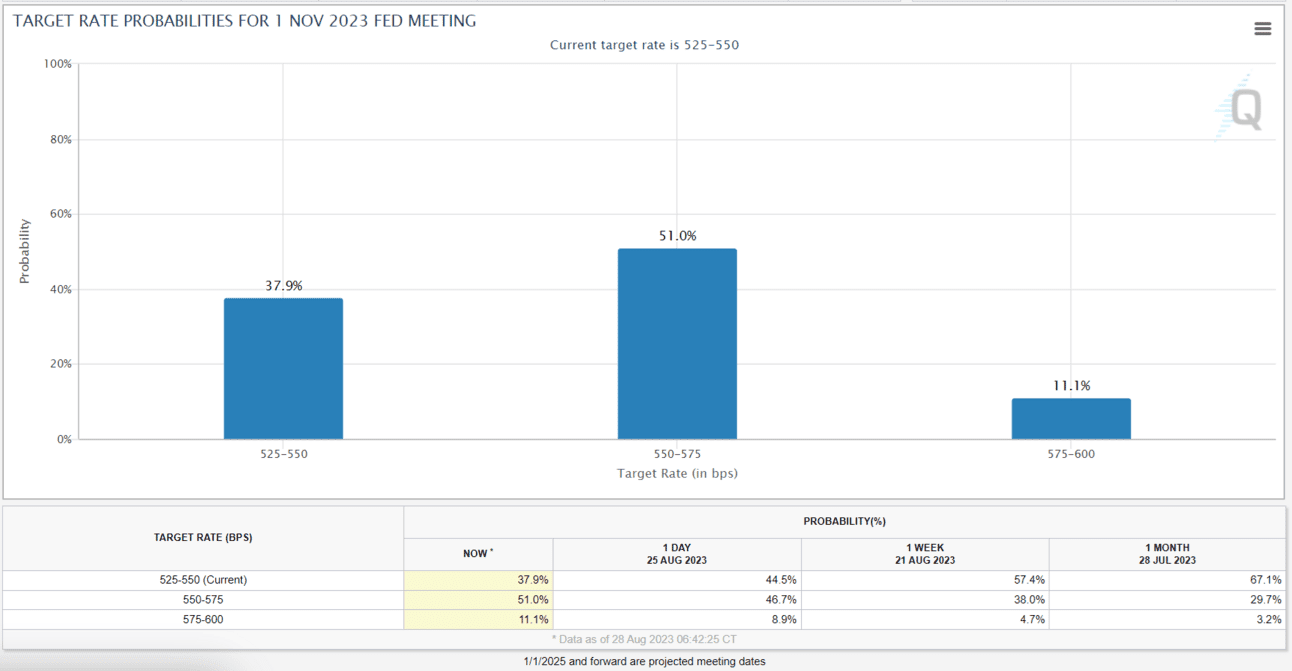
A Mild Jackson Hole: Fed’s Muted Signals
Contrastingly, this year’s Jackson Hole symposium delivered a muted message. Federal Reserve Chairman Jerome Powell presented no groundbreaking information but continued to emphasize progress on curbing inflation. While Powell indicated that interest rates might rise due to persistently high inflation, market expectations suggest otherwise. Investors now place a 50% probability on a 25 basis points rate hike in November, a considerable jump from last month’s sub-30% forecast.
China’s Capital Market Reforms: A Mixed Reaction
In a bid to make its capital markets more enticing, China has announced a reduction in stamp duties on stock trades, formerly the largest expense for traders in the country. Alongside this, the government also lowered the deposit ratio for margin financing and has slowed the pace of Initial Public Offerings (IPOs). Despite these seemingly positive steps, Chinese stocks experienced a tumble at the start of the week.
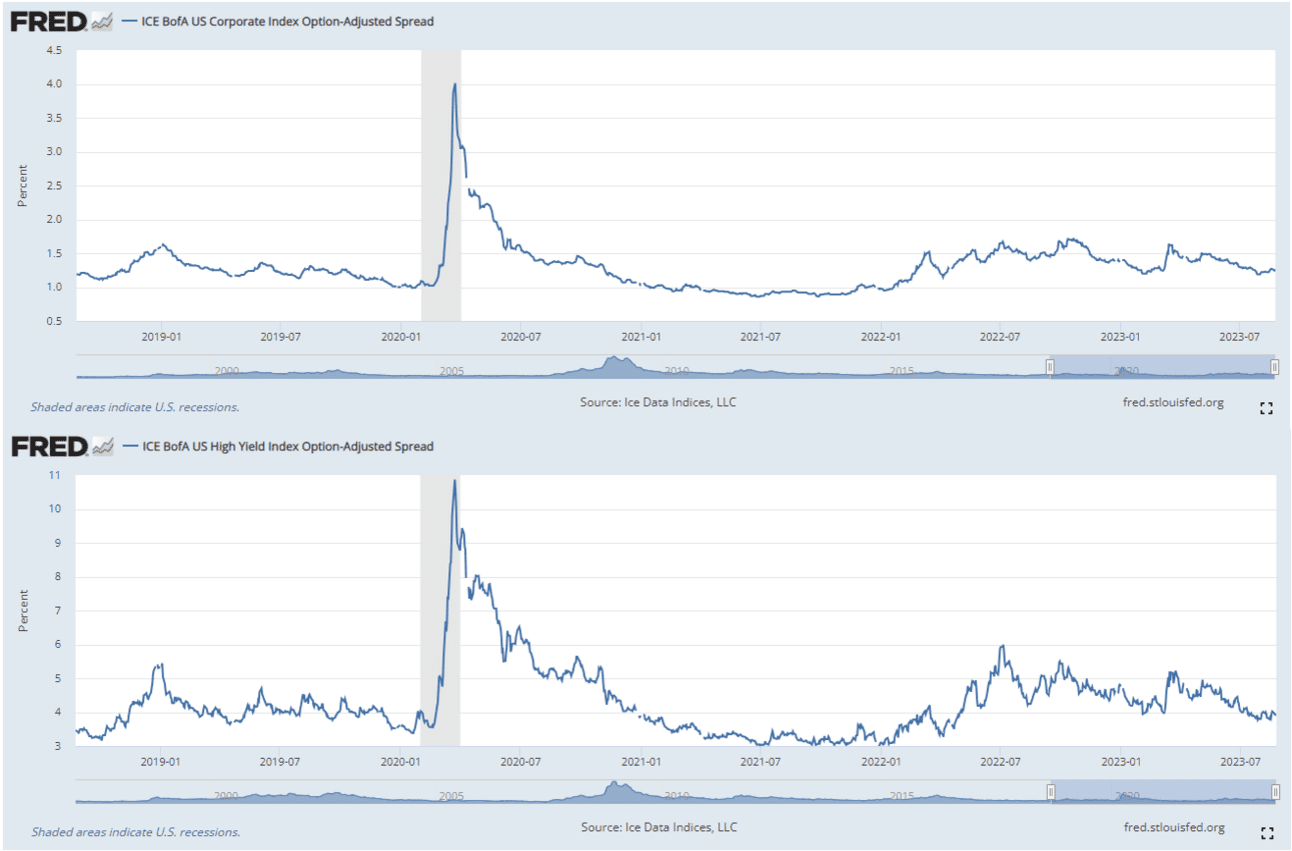
Corporate Spreads: A Gauge for Investor Confidence
One way to evaluate investor confidence is through the lens of corporate yield spreads over risk-free Treasuries. Current trends suggest that these spreads are narrowing, indicating increasing optimism about corporate profitability. Since the banking crisis in March, these spreads have steadily declined, hinting at a brighter outlook for corporate America.
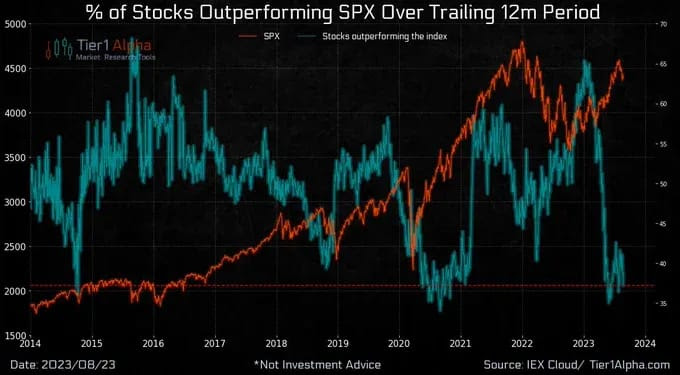
Breadth and Depth: Indicators of Market Health
Data shows that less than half of the S&P 500 is trading above its 200-day moving average (DMA), and under a third are above their 50DMA. Furthermore, nearly 80% ended last week below their 20DMA. The only sector showing substantial strength is Energy, where 91% of its constituents are trading above their 50DMA. This paints a complex picture of the market’s overall health as we head into the final stretch of 2023.
Oil Rig Count: The Energy Sector’s Pulse
The U.S. rig count, a leading indicator of future oil output, declined yet again. Data reveals that the total rig count fell by 10 to 632, while the number of oil rigs dropped to 512 from 520. Both numbers mark lows not seen since early 2022, indicating a ninth consecutive month of declines in active oil rigs.
Safe Trading
Team of Elite CurrenSea
Flagship


Leave a Reply