Deciphering February CPI Data

The market continues to surprise many, with calls for “this rally is too extended”, “higher for longer (both CPI and rates)”, and of course, “Oh look! meme stocks are on a run again, we know how that ends!”. Mike Wilson has released yet another lengthy piece on earnings continuing to struggle and the market being overvalued. Despite all this, the path of least resistance remains to be…up.
Economists are trying to assess the impact of rate hikes on the real economy, and CPI provides a key tea leaf. In this article, we’ll cover the CPI print in depth, going over expectations, relevant FOMC comments, changes in methodology, the numbers, and supplemental data.
Going into the Print: Expectations, Relevant FOMC Comments
The CPI print has been closely correlated with FOMC meetings, as higher inflation calls for more hawkish comments from Powell to put a lid on it.
Last week, Powell mentioned “disinflation” 15 times during his presser, sending risk assets into a party-on mode, as many are expecting a pause in the rapid rate-hiking cycle.
When it comes to understanding the lagged impact of rate hikes, some argue that traditional lagging indicators such as housing can be affected in a shorter amount of time.
Technology, lowering transaction costs, and the presence of different buyers (REITs, Investors, iBuyers, etc.) can all contribute to this.
Also, the free flow of information about rising prices can create self-fulfilling inflation expectations, as consumers demand higher salaries to pay for these prices.
Before getting to the print, it’s important to note the change in reporting method that took place. Beginning with January 2023 data, the weighting method for Owner’s Equivalent Rent (OER) was adjusted, with OER now accounting for more than a quarter of the total calculation, and housing overall accounting for more than 44 percent.
Breaking Down the CPI by Numbers
Used car prices have been lowered in importance after a year of out-of-sync wholesale and retail used car prices. Additionally, weights for the CPI will now be updated annually using 2021 consumer expenditure data, a change from the prior biennial practice.
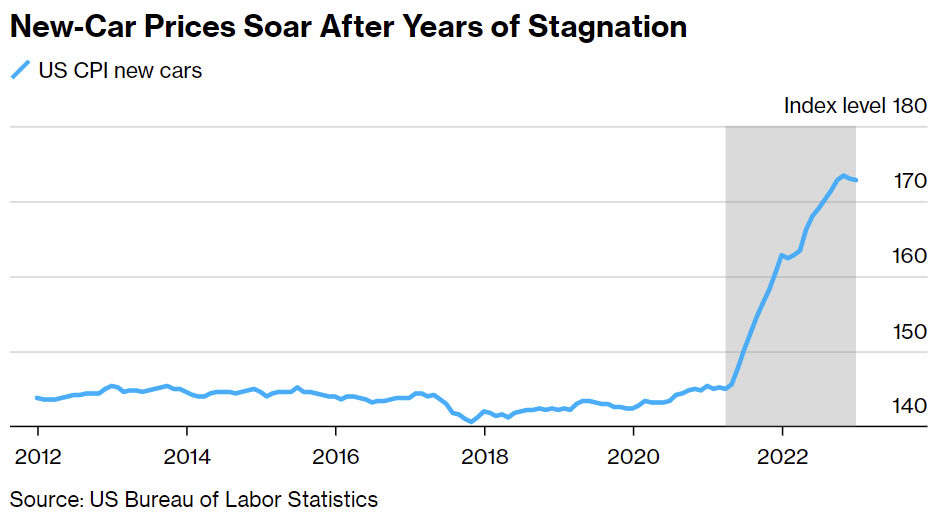
Vehicles
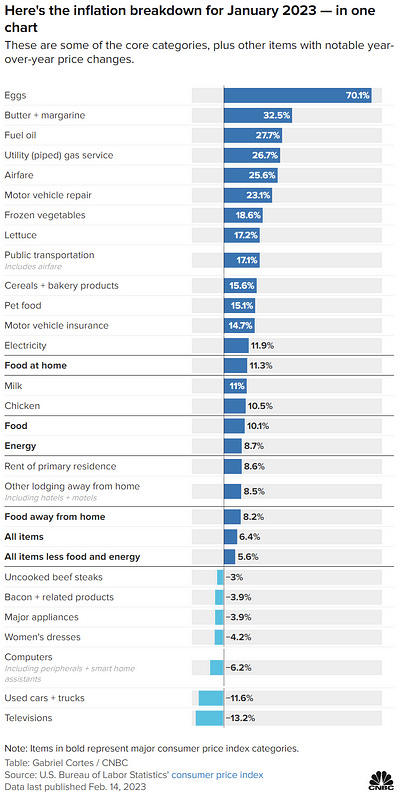
The used car portion of CPI has been decreasing MoM, now down 11.6% YoY. This doesn’t match up with the Manheim Index’s uptick at the beginning of the year.
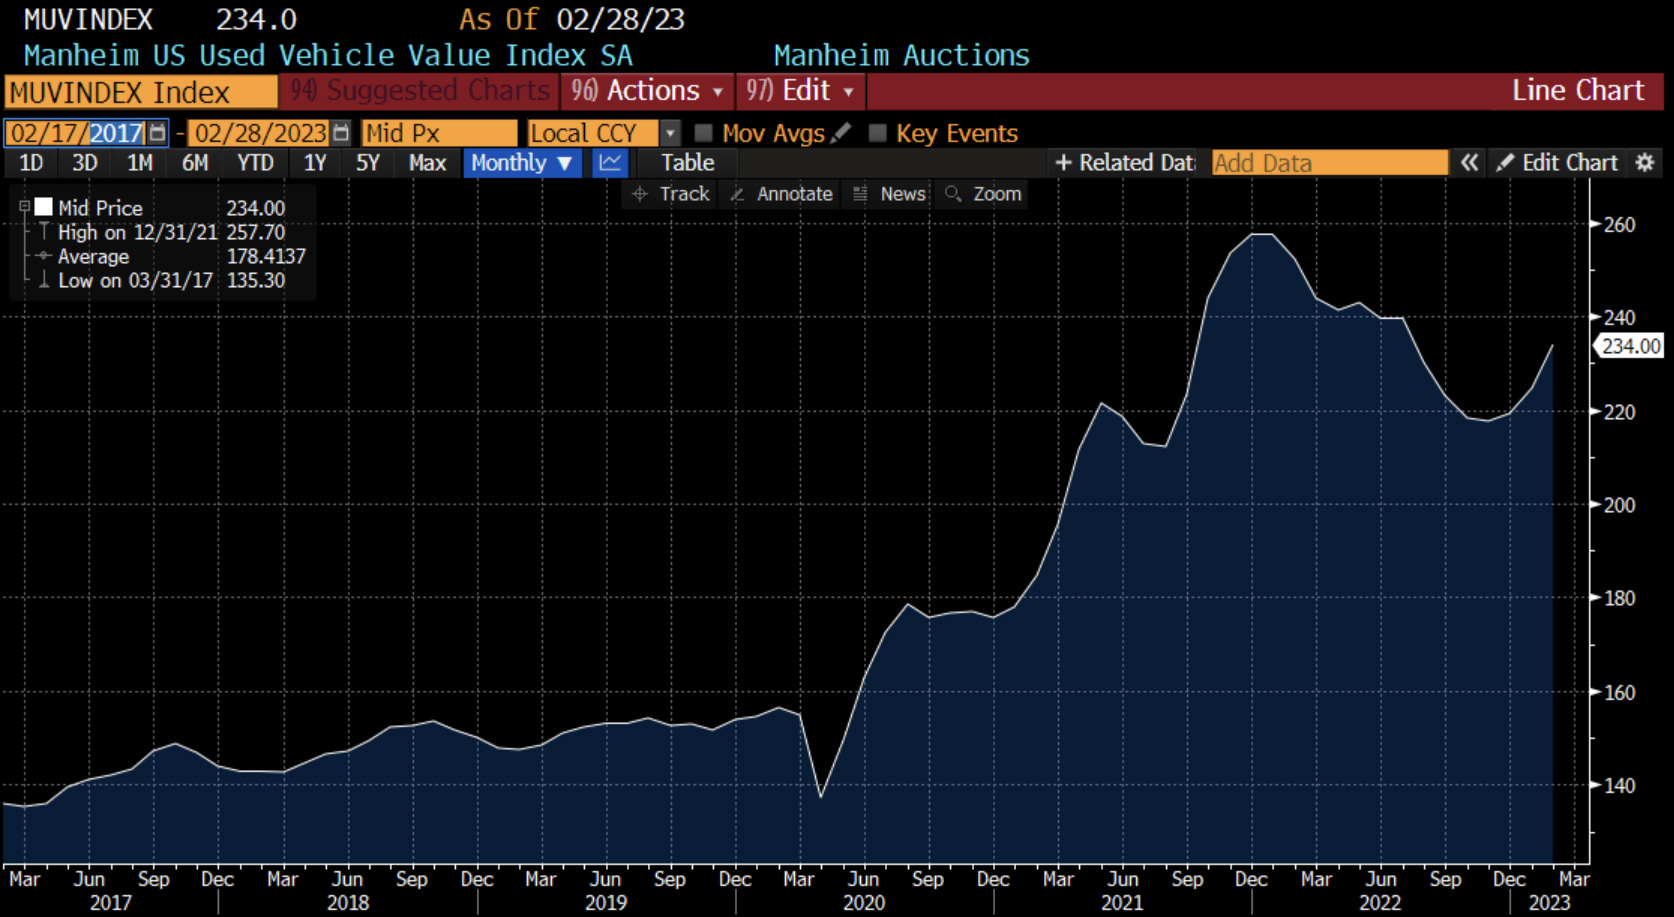
The difference lies in the gap between new and used cars; used cars are more a function of disposable income, while new cars are typically financed and their rates are pegged to the rest of the interest rate market. As a result, the average monthly payment for a new car has soared to a record-breaking $777, nearly double from late 2019.
Food
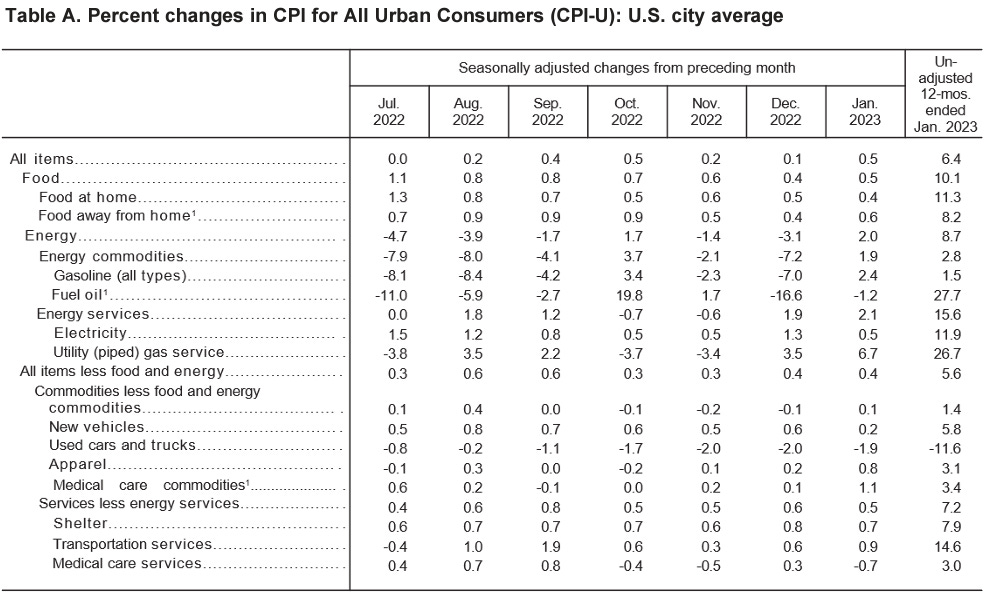
Inflation is still quite sticky when it comes to the grocery store bill, up another 0.5% MoM, and 10.1% YoY. This is one of the most core components of inflation that affects consumers daily.
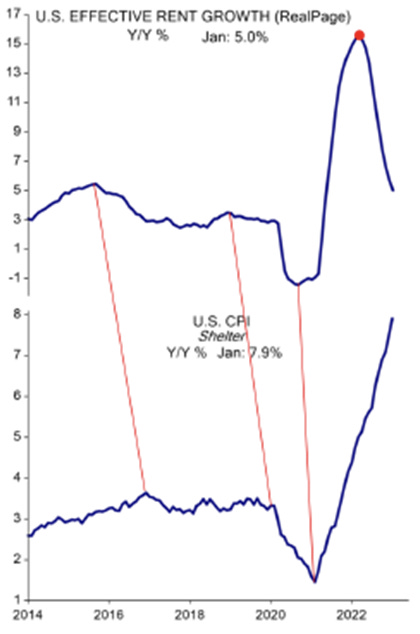
Shelter
Shelter added another 0.7% increase MoM, now up 7.9% YoY. The lagged impact of this is important to consider. Rents have turned a corner in the market, but not yet in CPI.
Energy
The volatile energy components remain volatile. Utility gas services were up 6.7% MoM and 26.7% YoY, while fuel oil decreased 1.2% MoM, now only up 27.7% YoY. It’s good to see some months where energy costs stabilize, as fuel costs generally pass on through the entire goods market.
Supplemental Data: Retail Sales, PPI, NFIB
We recently had a number of economic data releases. Jan’s nominal retail sales were much stronger than expected, up +3.0% MoM and +6.4% YoY in Jan.
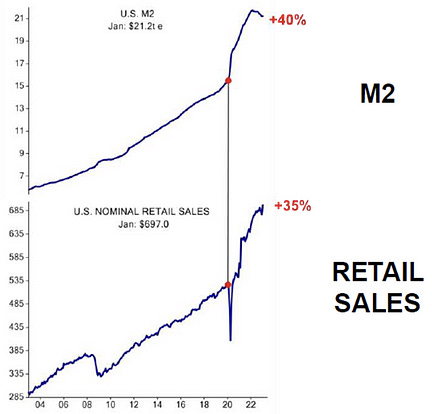
Retail Sales
January’s nominal retail sales showed strong results, surpassing estimates with a rise of +3.0% MoM. Excluding motor vehicle sales, the increase was +2.3%, and the headline reading was up +6.4% YoY. However, when taking inflation into consideration, the American consumer may be in trouble. Genevieve Roch-Decter, CFA, shared her thoughts on the matter on FOX, pointing out that the government is covering it up.
PPI
The January Producer Price Index (PPI) data came in firmer than expected, with the headline reading up 0.7% and the core index (ex. food and energy) up 0.5%. Year-over-year inflation rates for these aggregates moderated between December and January, but the seasonally adjusted monthly changes reported for January were the strongest since the middle of last year.
Conclusion
The economy remains a complex and multifaceted phenomenon. Numerous indicators have been presented that appear to be conflicting in nature. On the one hand, robust retail figures and a healthy labour market have been observed; on the other hand, company earnings, an inverted yield curve, and a “higher for longer” Federal Reserve policy point towards the increased likelihood of a recession.
In this tug of war between opposing forces, it is important to be proactive in selecting securities, remain patient with one’s long-term investment strategies, and take advantage of pullbacks to add to positions in high-conviction stocks.
Safe Trading
Team of Elite CurrenSea 🇺🇦❤️


Leave a Reply