☝️ DJI 30 Bullish Bounce in Aftermath of US Presidential Elections ☝️

Dear traders,
the Dow Jones Index (DJI 30) showed a strong bullish rebound last week. The rally managed to turn the tables quickly and price action is now testing all-time highs.
This article reviews the wave patterns and expected price path in the upcoming weeks on the daily and 4 hour charts in the aftermath of the U.S. Presidential elections.
Price Charts and Technical Analysis
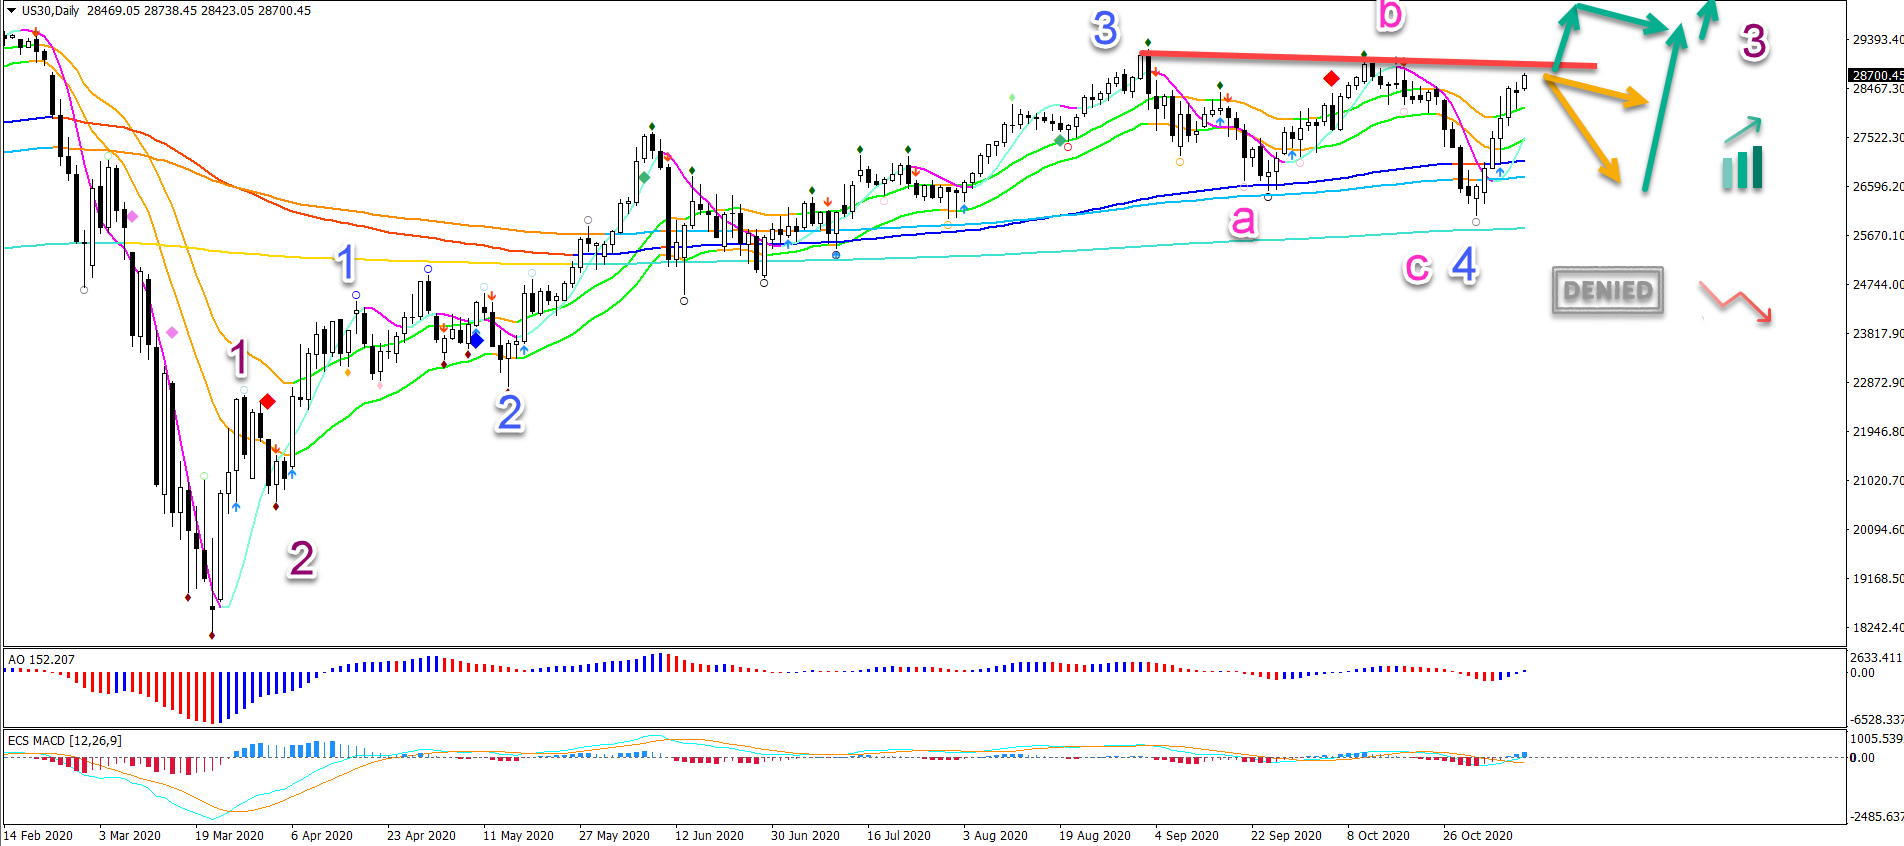
The DJI 30 bullish reversal occurred at the long-term moving averages. The rally indicates that the uptrend is far from over.
In fact, the bearish correction has been marked as an ABC (pink) pattern within wave 4 (blue). If that is true, the uptrend could last for a substantial time. Especially if price action is moving up within wave 3 (purple).
A pullback or rejection (orange arrows) at the resistance is possible. But the uptrend exception remains valid as long as price does not break below the long-term MA (red arrow). Any bullish bounce or breakout could confirm the uptrend.
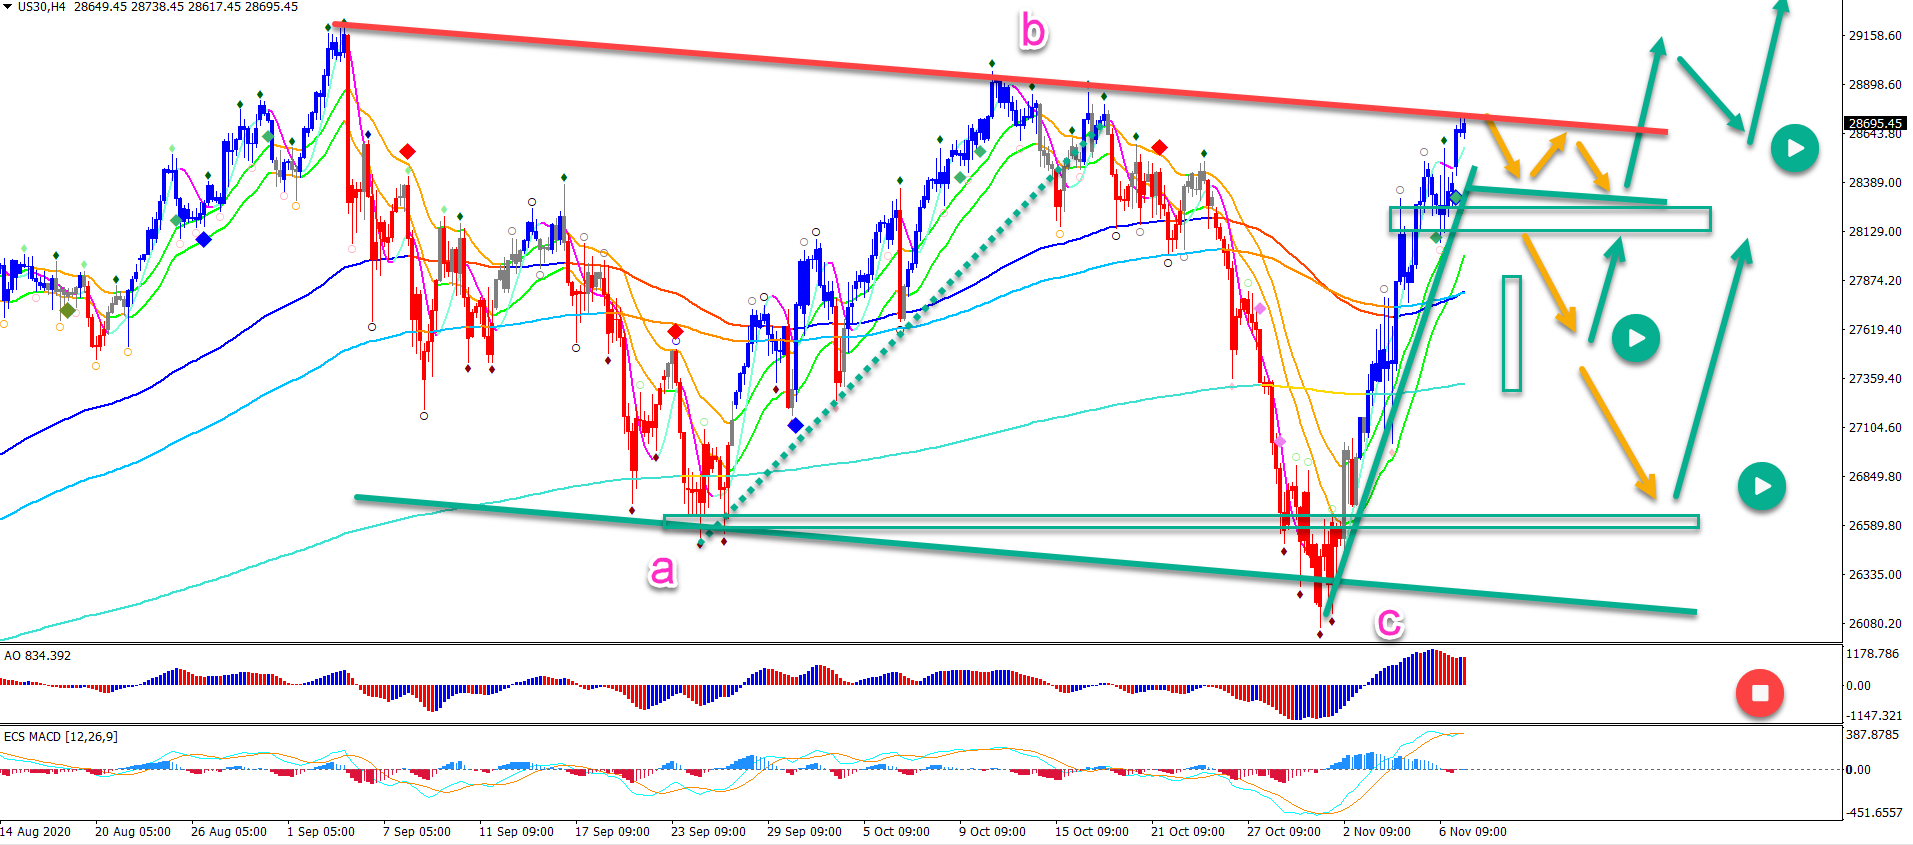
On the 4 hour chart, price action is clearly at a decision zone. This could create either a shallow pullback, deep retracement, or full breakout.
Price action breaking below the bottom invalidates (red circle) the bullish outlook. A bullish breakout is an immediate confirmation of the uptrend. But even a bullish bounce after a retracement or pullback could confirm the uptrend.
The analysis has been done with the indicators and template from the SWAT method (simple wave analysis and trading). For more daily technical and wave analysis and updates, sign-up to our newsletter.
Good trading,
Chris Svorcik


Leave a Reply