Weekly Waves 9 January 2023: EUR/USD, GBP/USD and NGAS
January 9, 2023
5 min read
Hi Traders,
Our weekly Elliott Wave analysis reviews the EUR/USD daily chart, the GBP/USD monthly chart, and the NGAS daily chart.
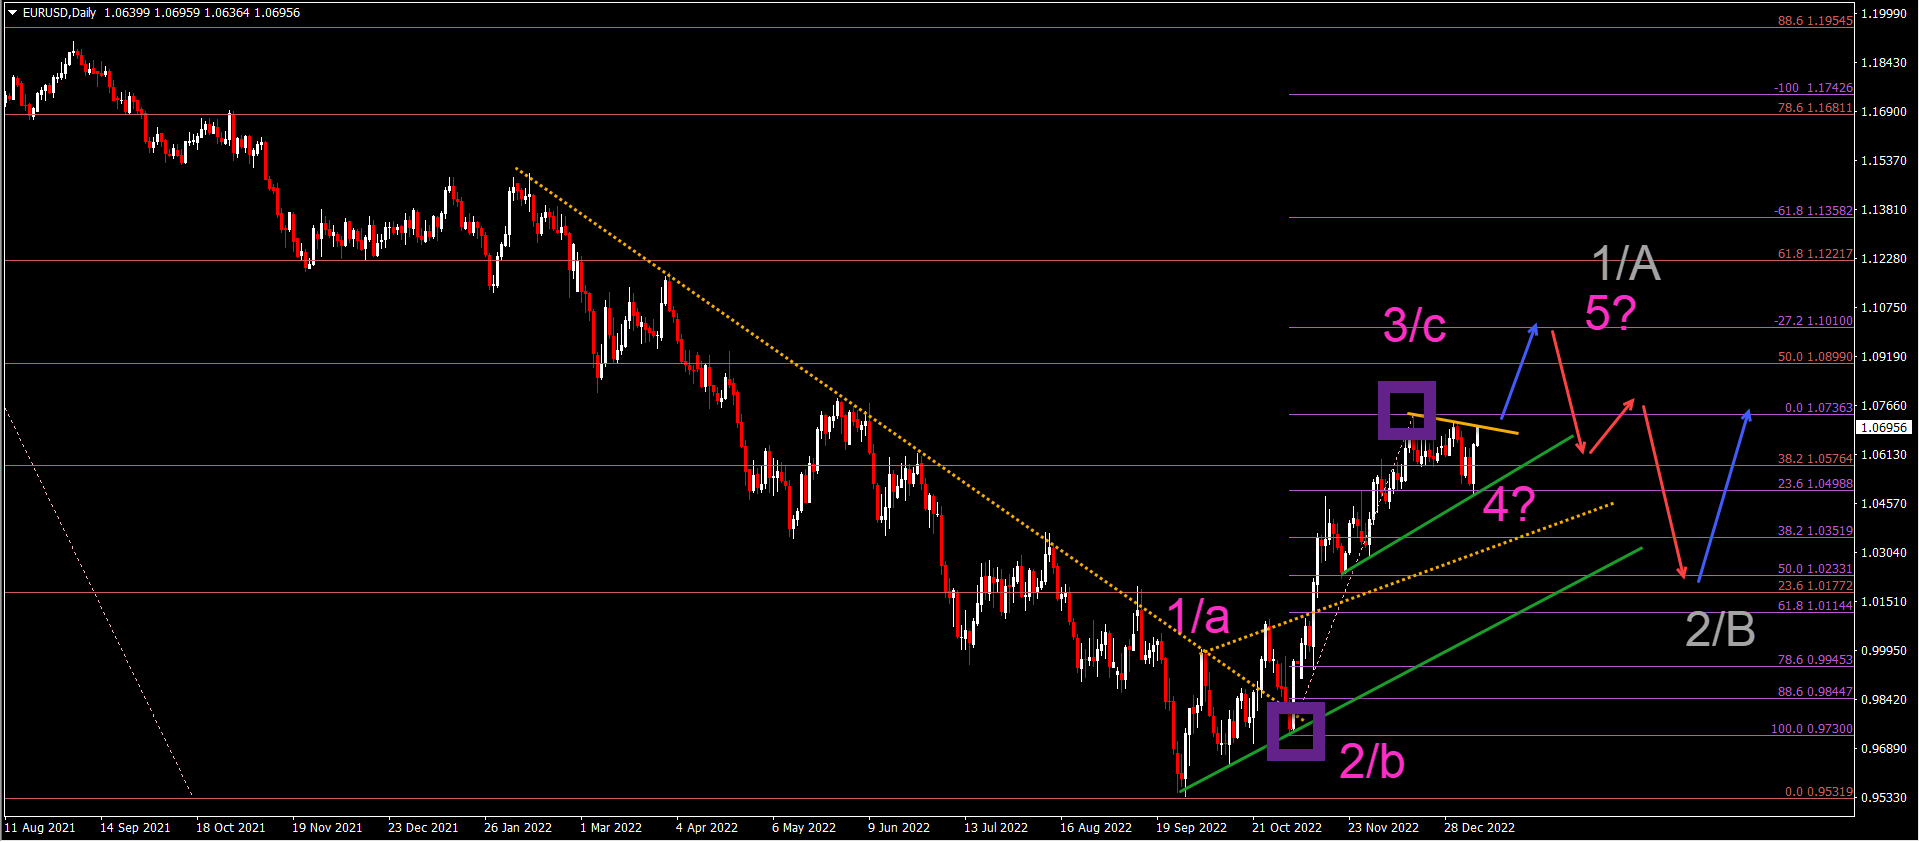
EUR/USD Downtrend in Serious Danger of Reversal
The EUR/USD has reached a critical spot, which will determine whether the long-term outlook remains bearish or whether the trend will switch to bullish:
- The EUR/USD is testing the key 38.2%-50% Fibonacci resistance zone (purple levels).
- But the bullish price action is surprisingly strong and impulsive, which indicates a potential wave 3 (pink).
- Until now we have labeled the bullish price swing as a wave C (pink), but the shallow corrective price action is indicating a wave 4 (pink) pattern.
- The shallow price action is because price has bounced at the 23.6% Fibonacci support level of the purple price swing.
- A bullish breakout (blue arrow) above the resistance (orange) could confirm a wave 5 (pink) of a larger wave A or 1 (gray).
- A breakout below the 38.2% Fibonacci support level (purple) of the wave 3 could indicate that the ABC (pink) correction is valid (not the 12345).
- If the price action does break north, then it could indicate the pause or end of a long-term downtrend and a larger bullish correction or uptrend.
ATHENA EA
#H1
#H4
#Time frames
Award Winning Momentum TradingPromo
Yearly Target:
220%
Risk/Reward:
0.36
Platforms:
MT4
Historical Drawdown:
30%
Min. Deposit:
50$
Asset Types:
Forex

Presented by
Chris Svorcik
Verified on:
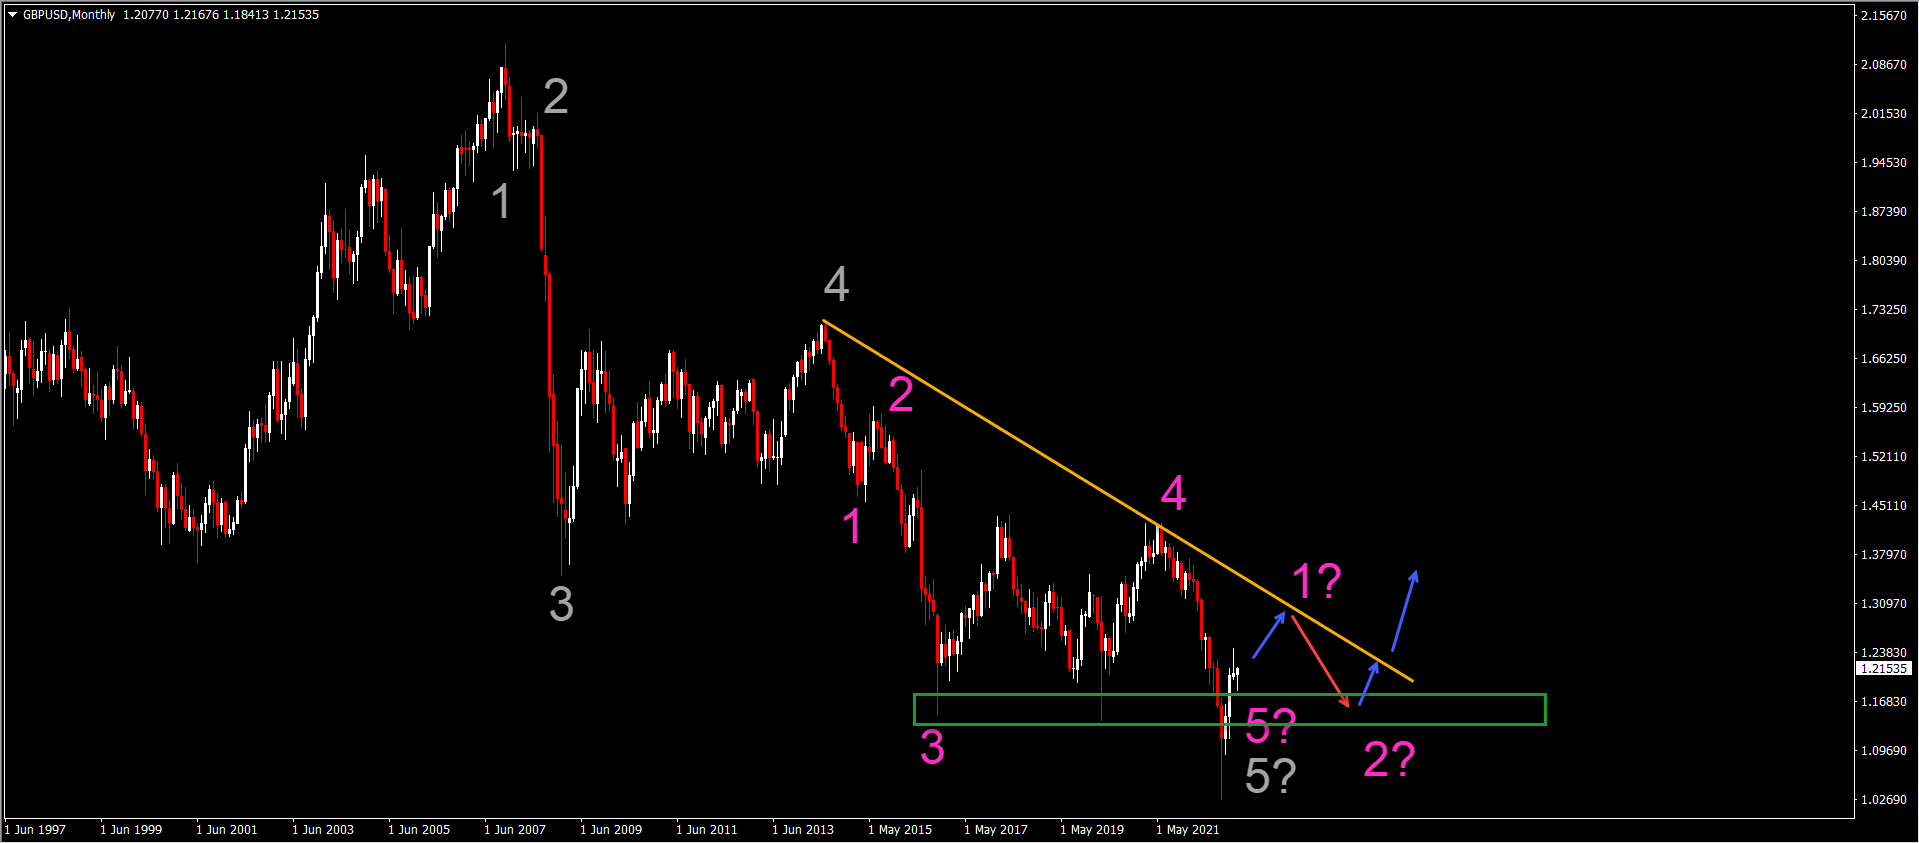
GBP/USD Bears Losing Control of the Trend
The GBP/USD is showing strong bullish price action as well. The strong monthly candlesticks are indicating that the Cable could go higher before finding resistance (orange line):
- The GBP/USD Elliott Wave count has remained bearish since the decline started at the top where wave 4 (pink) has ended.
- But the bullish price action followed by the weak bearish reaction could indicate that the downtrend might be finished.
- In that case, the lower low could complete a wave 5 (pink) of a wave 5 (gray).
- Another bullish push higher could confirm a wave 1 (pink), after which we expect a bearish wave 2 (pink).
- The support zone (green box) is expected at the previous lows, which could create a long-term inverted head and shoulders reversal chart pattern.
- The bearish outlook could remain intact if price action is able to break below the 1.17 support zone.
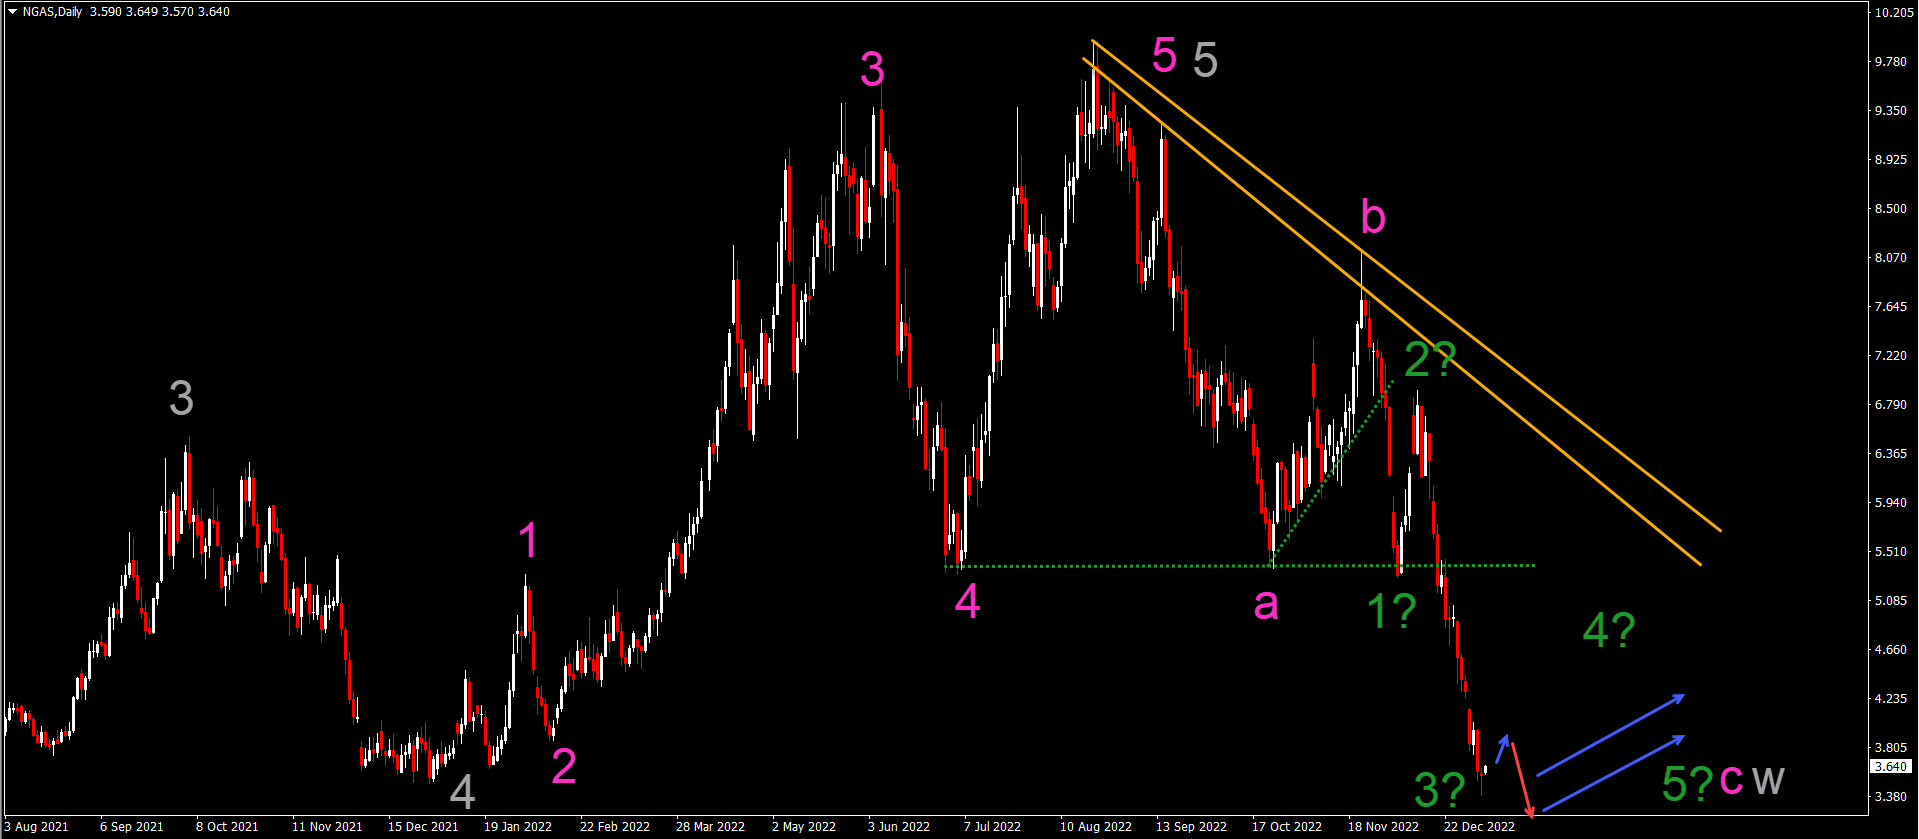
NGAS Falls Down Quickly in Bearish Impulse
The NGAS chart has made a strong downtrend continuation – as we expected in our regular Elliott Wave updates on NGAS in 2022:
- The NGAS chart’s downtrend is expected to be a wave 3 (green) because of the strong impulsive decline.
- The wave 3 (green) could continue lower. A small retracement (blue arrow) could follow up with another bearish swing lower (red arrow) before the wave 3 (green) is finished.
- Eventually once the wave 3 (green) is completed, a larger bullish correction should emerge within a wave 4 (green).
- Usually waves 4 are complex and lengthy, but eventually a new push lower within the wave 5 (green) of wave C (pink) of a potential wave W (gray).
Good trading,
Chris Svorcik


Leave a Reply