? EUR/AUD Long-term Bullish Break Aims at 1.69 Target ?

Dear traders,
the EUR/AUD broke above the long-term key resistance trend line (orange line). This could indicate a major bullish reversal.
EUR/AUD
4 hours chart
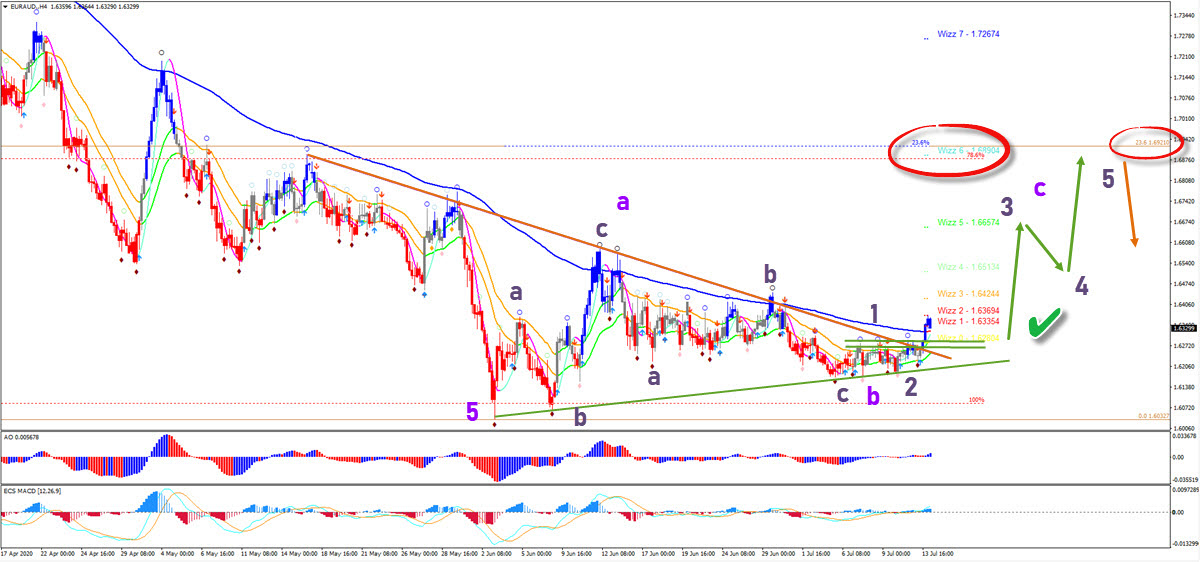
The EUR/AUD was unable to break below the 100% Fibonacci support. This bounce could complete a wave 5 (purple). Recently price has made several higher lows, which could be a finished wave B (purple). The current breakout is pushing above the 144 ema close as part of a potential wave 123 (light purple).
The EUR/AUD recent tops are potential support (green lines) and could act as a bouncing spot for a wave 3. A 5 wave pattern could take price up towards the main target zone at 1.69. The Fibonacci resistance could complete the bullish ABC and a downtrend could restart.
The analysis has been done with SWAT method (simple wave analysis and trading).
For more daily technical and wave analysis and updates, sign-up up to our newsletter.
Good trading,
Chris Svorcik
Elite CurrenSea


Leave a Reply