❗️ EUR/AUD Expects Massive Triangle Pattern on Weekly Chart ❗️

Dear traders,
the EUR/AUD bullish breakout didn’t last long before the bears wrestled back control. Will the uptrend be able to regain control or will price action develop a larger reversal?
EUR/AUD
Price Charts and Technical Analysis
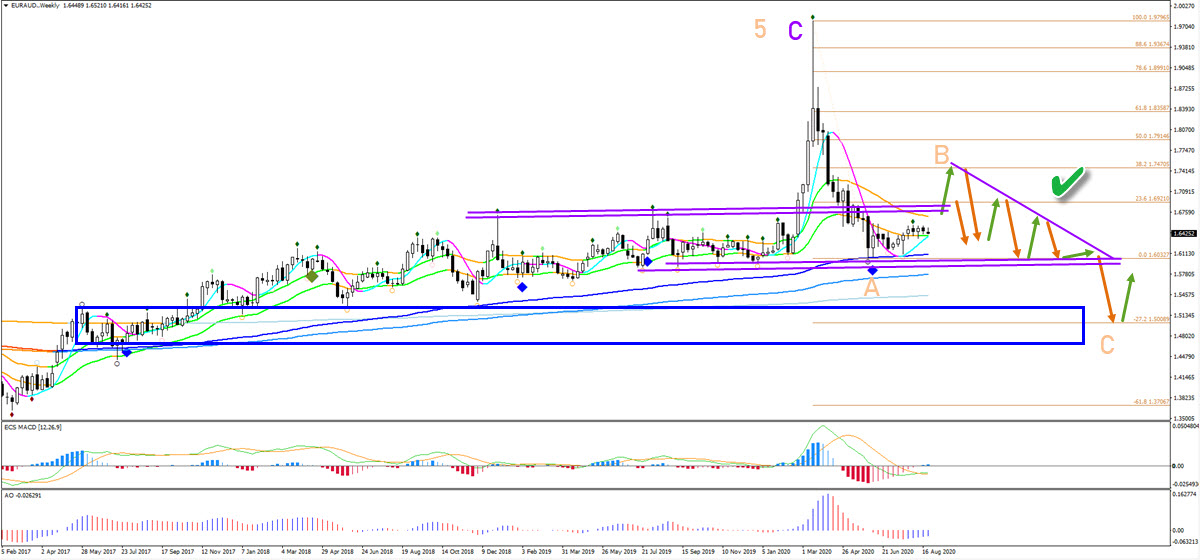
The EUR/AUD seems to have completed a wave 5 of wave A (purple) at the most recent high. This could indicate the end of the uptrend. The bearish correction is therefore probably a larger ABC (orange) pattern. The recent bullish bounce at the long-term moving averages probably finished the wave A of that ABC.
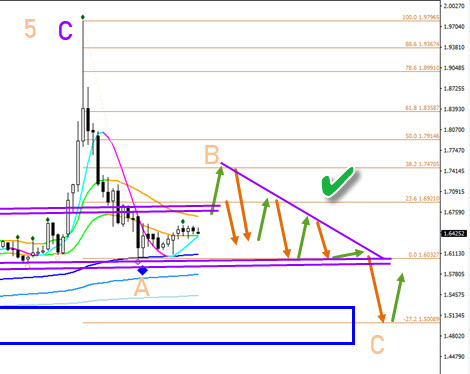
Now price is probably ready for a bullish bounce within the expected wave B (orange). A break above the resistance and 21 ema zone could confirm the push higher. A logical resistance spot is the 38.2% Fibonacci retracement level. A bearish descending wedge triangle pattern could emerge within the wave B before price is expected to break south towards the -27.2% Fibonacci target.
The analysis has been done with SWAT method (simple wave analysis and trading).
For more daily technical and wave analysis and updates, sign-up up to our newsletter.
Good trading,
Chris Svorcik
Elite CurrenSea


Leave a Reply