Weekly Waves 5 September: EUR/USD, Gold and Bitcoin
September 5, 2022
5 min read


Hi Traders,
Our weekly Elliott Wave analysis reviews the EUR/USD 4 hour chart, the Gold weekly chart, and the Bitcoin crypto currency daily chart.
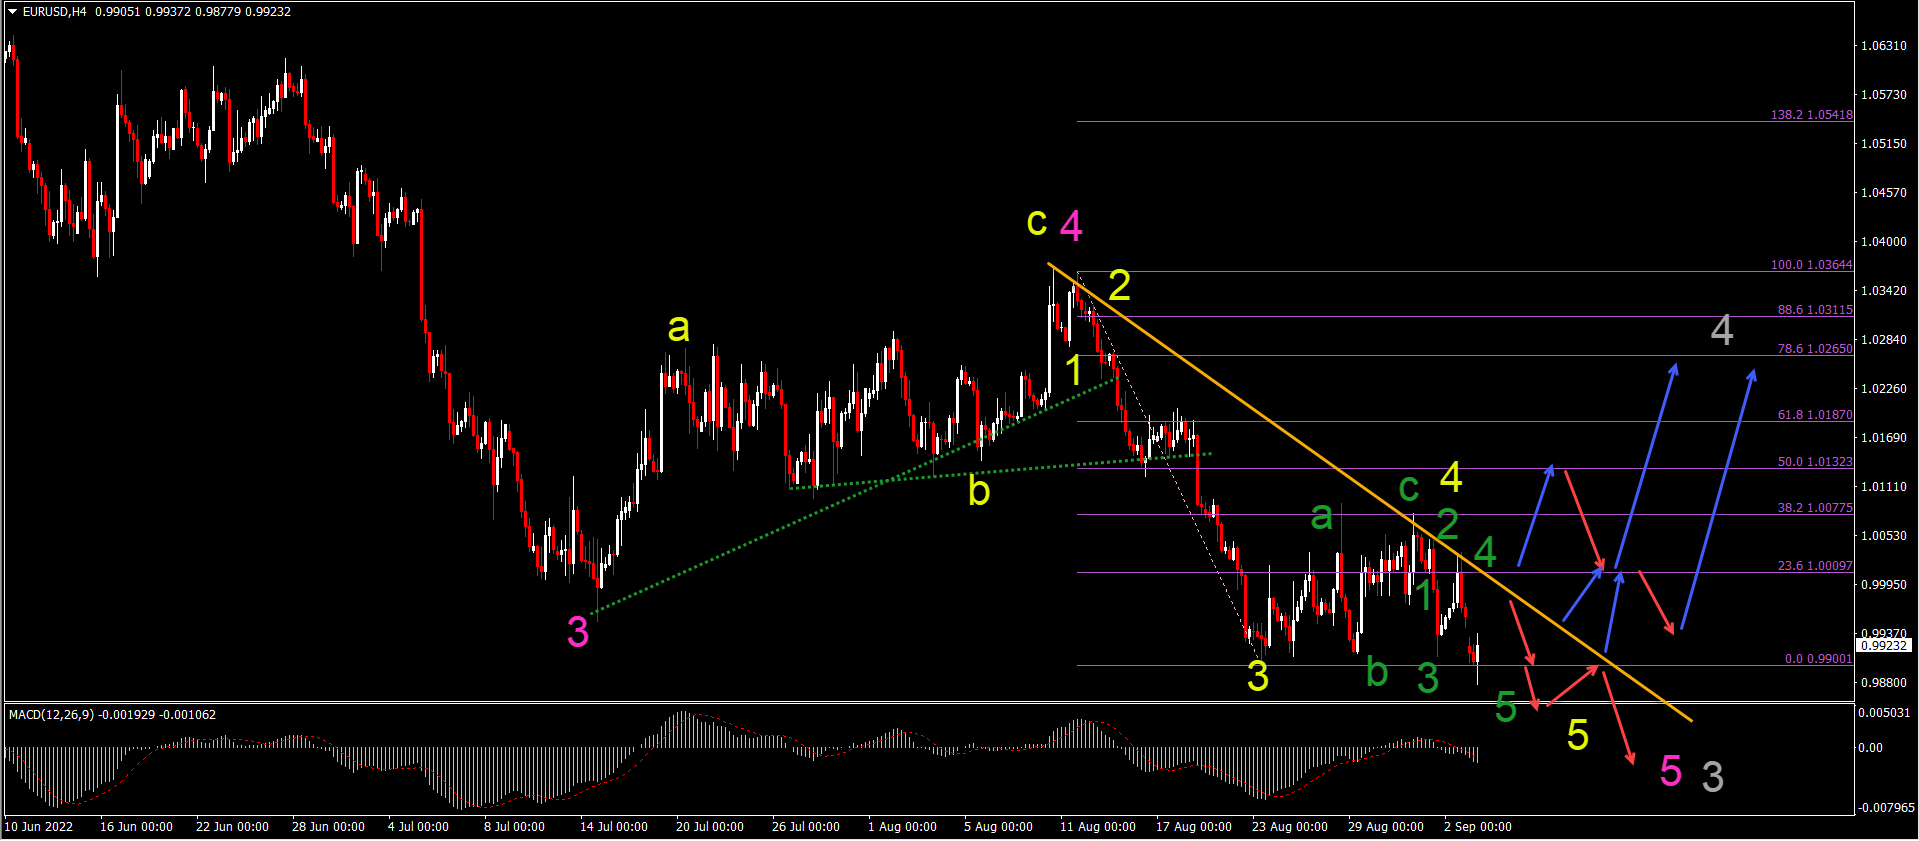
EUR/USD New Low Aims at 0.9750 Target
The EUR/USD made a new low again after a shallow bullish correction:
- The EUR/USD made a bearish bounce at the 38.2% Fibonacci retracement level.
- The break below the previous bottom could either be part of a complex wave 4 (yellow) or part of the downtrend within wave 5 (yellow).
- We prefer the wave 5 scenario and expect price action to make a bearish bounce at the resistance trend line (orange) and/or break the bottom and a new lower low.
- The main target zone is the support area around 0.9750-0.98.
- A break above the resistance trend line (orange) would however change the perspective and indicate the end of the downtrend.
- A stronger bullish retracement could emerge within wave 4 (gray) after price action completes wave 5 (yellow) of wave 5 (pink) of wave 3 (gray).
ATHENA EA
#H1
#H4
#Time frames
Award Winning Momentum TradingPromo
Yearly Target:
220%
Risk/Reward:
0.36
Platforms:
MT4
Historical Drawdown:
30%
Min. Deposit:
50$
Asset Types:
Forex

Presented by
Chris Svorcik
Verified on:
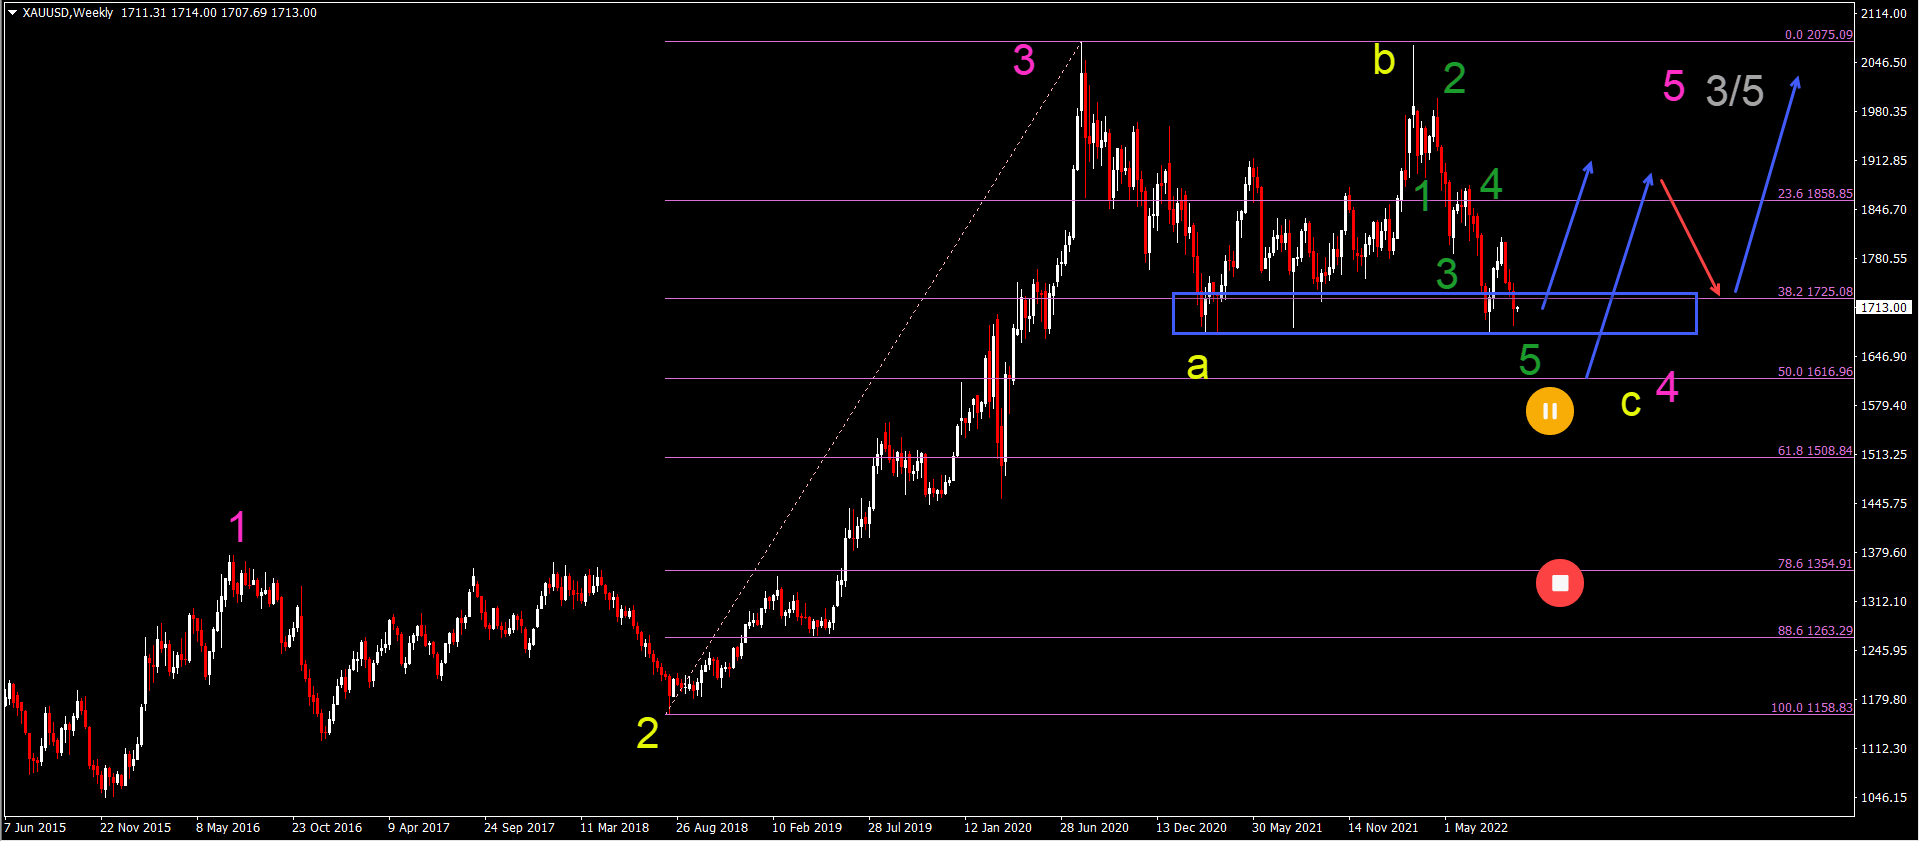
Gold Testing Key 38.2% Fibonacci Support
Gold (XAU/USD) is testing the support zone (blue box) and Fibonacci retracement levels:
- The XAU/USD seems to be completing a wave 5 (green) of a larger ABC (yellow) correction in wave 4 (pink).
- The 38.2% and 50% Fibonacci support levels should remain unbroken if indeed this Elliott Wave analysis is correct and price action is within a wave 4 (pink).
- A break below the 50% Fibonacci is a first warning that the current bullish Elliott Wave analysis is incorrect whereas a move towards the 78.6% Fib invalidates it.
- A bullish recovery, however, could develop slowly with a momentum upwards (blue arrow) followed by a deep bearish retracement (red arrow).
- Price action might only break for a new higher high in 2023. First price action will need to test the double top and then after a bearish bounce, price action could push above it.
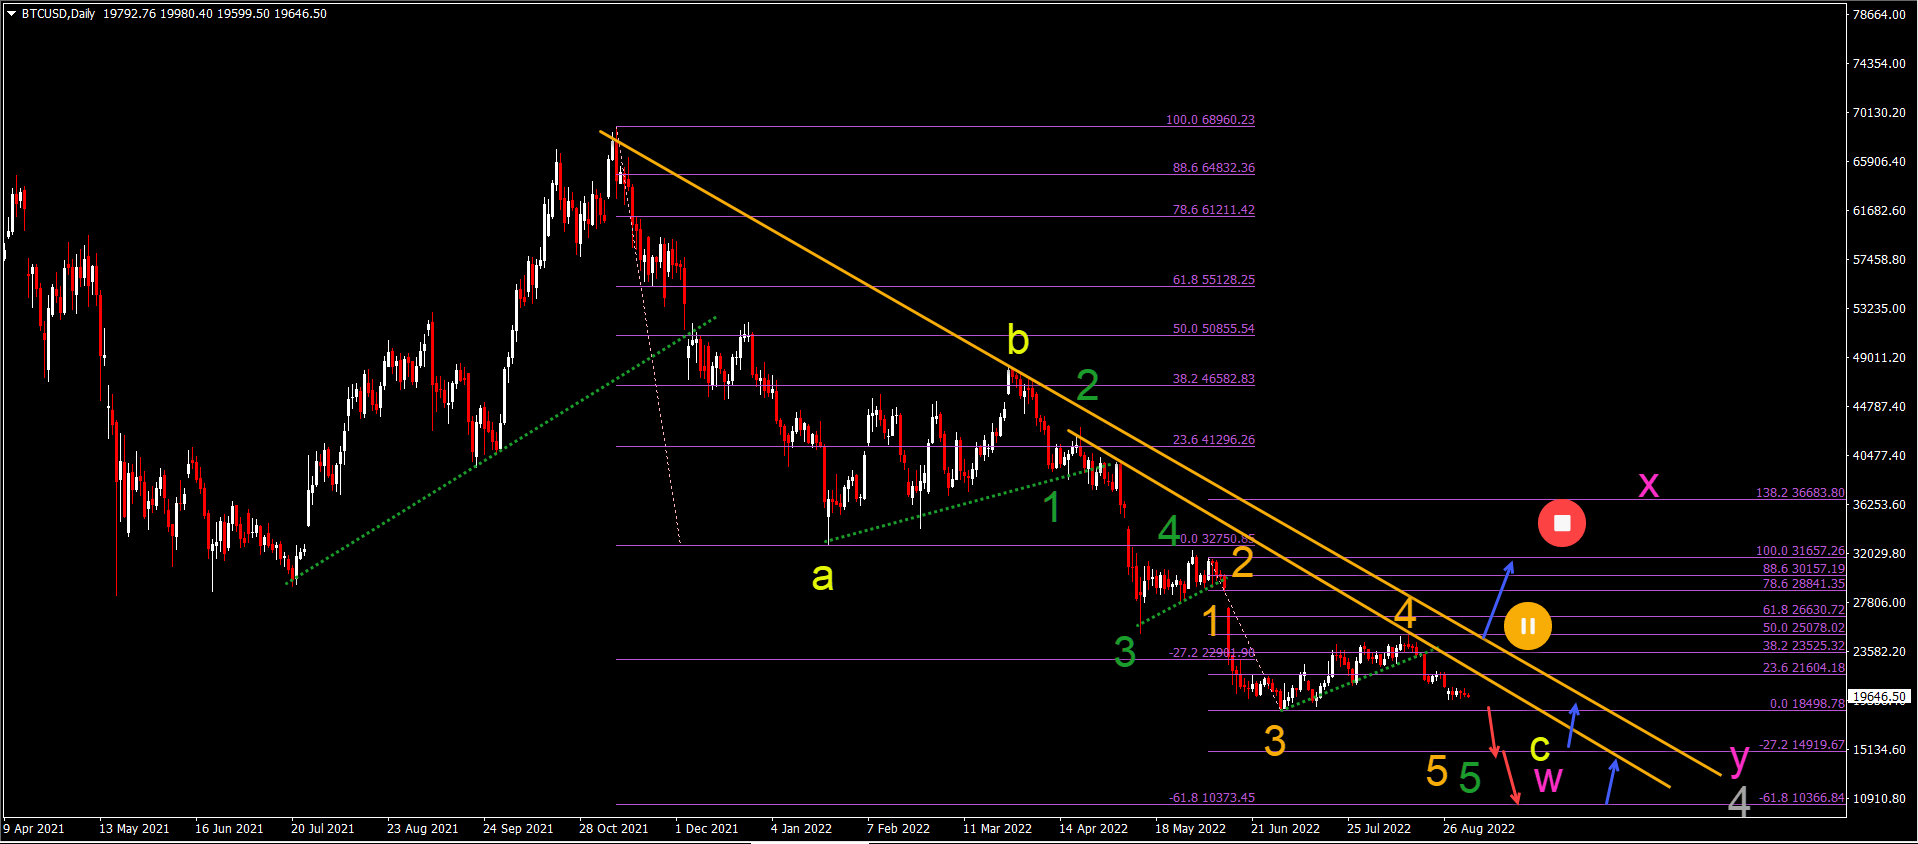
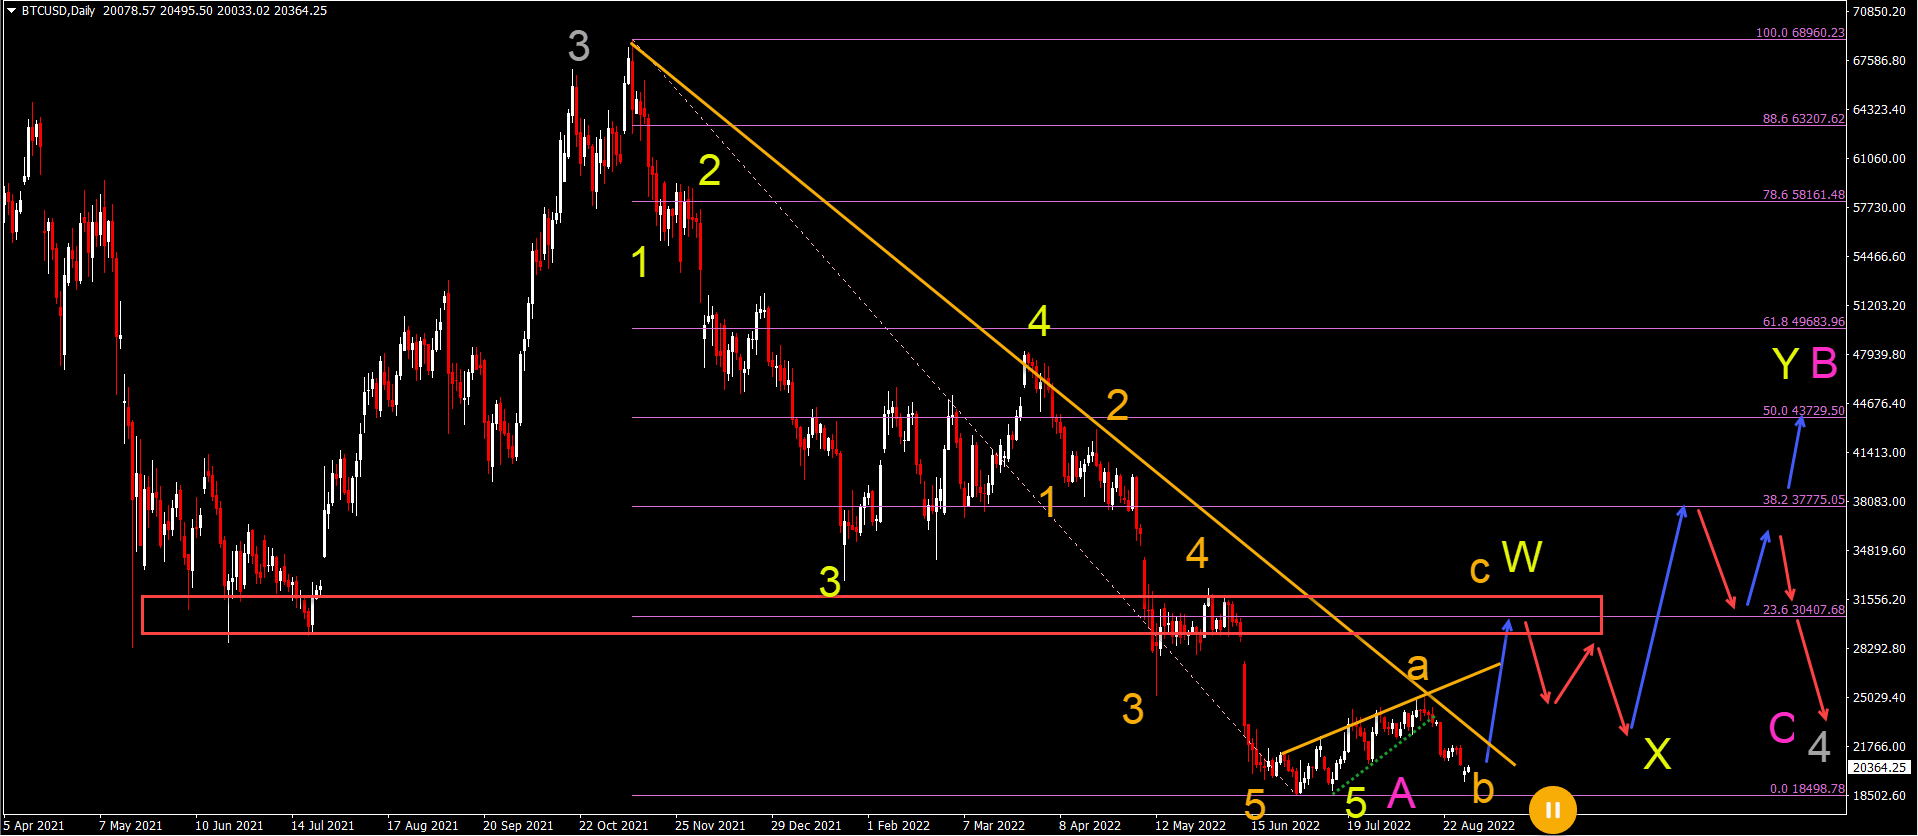
BTC/USD Price Action Too Bearish for Any Reversal
Bitcoin (BTC/USD) analysis from last week seems unlikely at the moment because of the bearish momentum and lengthy and shallow bullish price movement:
- BTC/USD needs a break above (blue arrow) the resistance trend lines (orange) and 50% Fibonacci level before the bulls can be optimistic about any kind of rally.
- Even though price action could make a bullish bounce at the previous bottom, the price action looks too bearish for any rally to succeed at this moment.
- Therefore, we decided to change the Elliott Wave analysis this week to provide a fresh and new perspective.
- The bullish correction was probably a wave 4 (orange) within a downtrend, rather than a wave A (or a larger ABC up).
- The current bearish swing is expected to be a wave 5 (orange).
- A break below (red arrows) the previous low would confirm the wave 5 (orange).
- The main bearish targets are $15k and $10k.
- A bullish rebound (blue arrows) is expected at one of these targets.
Good trading,
Chris Svorcik


Leave a Reply