Weekly Waves 8 Feb: EUR/USD, GBP/USD and Bitcoin
Subscribe
Hi Traders,
our weekly Elliott Wave analysis reviews the EUR/USD, the Bitcoin crypto currency, and the GBP/USD.
EUR/USD Bulls Spike Part of Triangle Pattern?
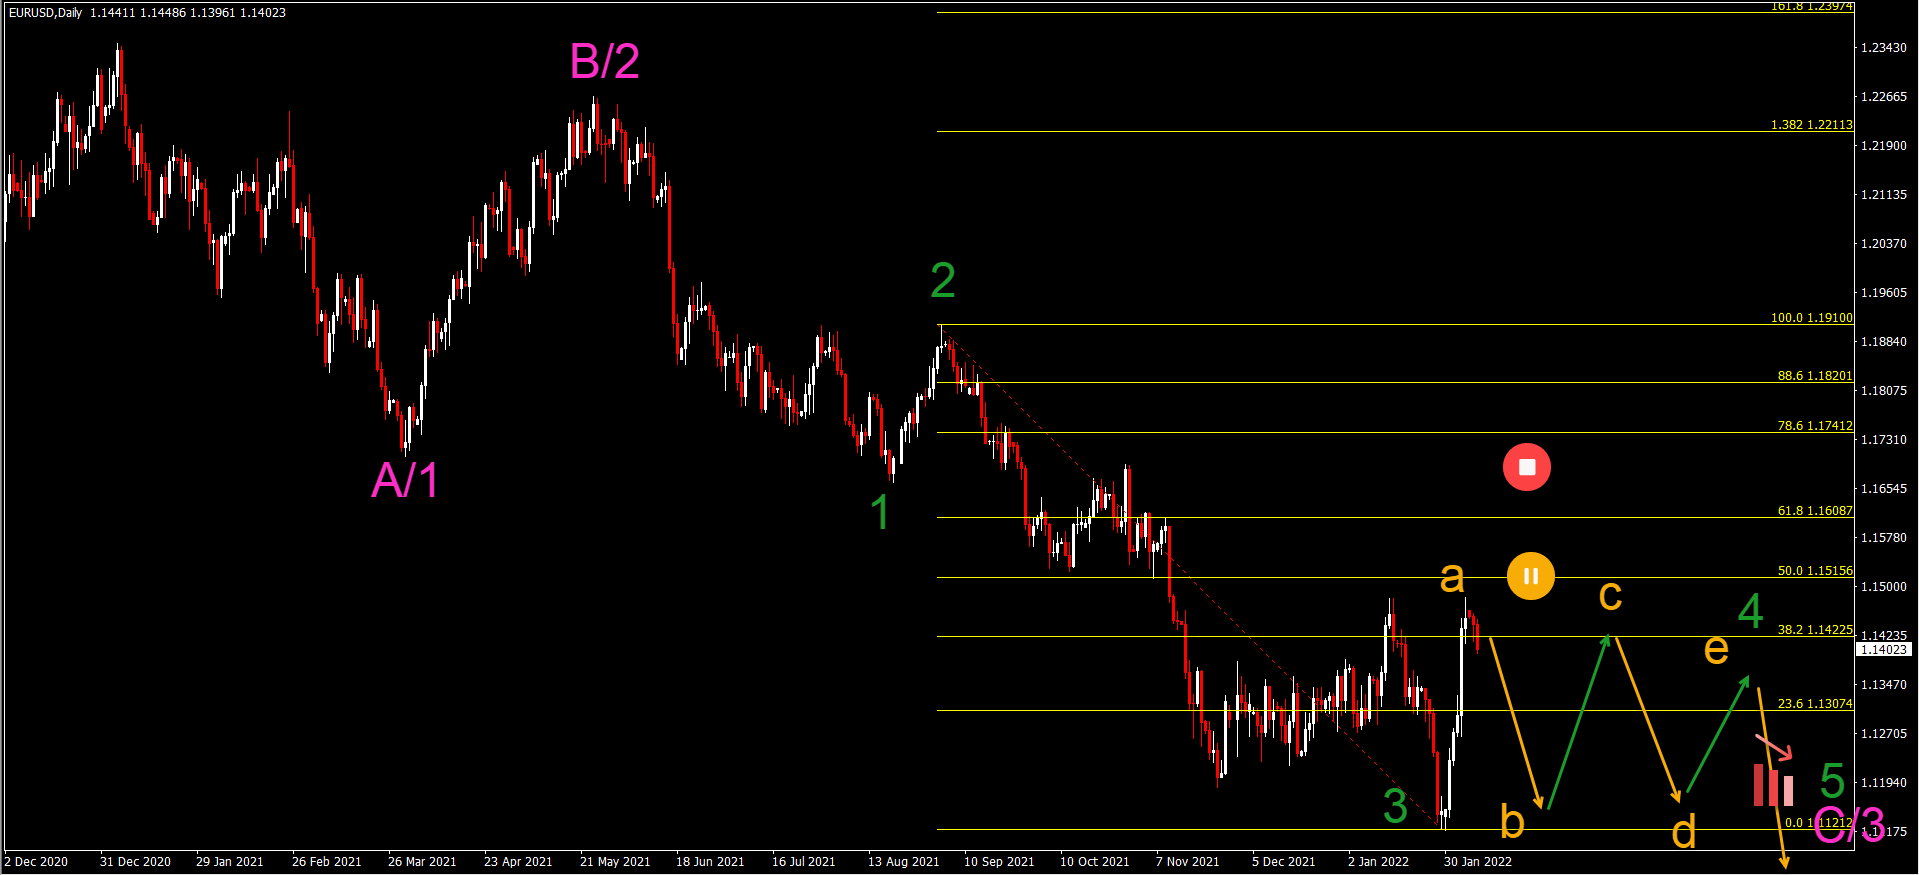
The EUR/USD looked bearish in last week’s Elliott Wave analysis but price action actually made a very strong bullish bounce.
- Is it time for a bullish reversal? Not yet in our analysis. Price action made a strong move up but has respected the 38.2%-50% Fibonacci resistance levels.
- The bullish swing is expected to be a wave A (orange) of a larger ABCDE (orange) triangle pattern. The triangle would confirm the wave 4 (green) pattern.
- A bearish breakout would indicate a wave 5 (green) of wave 3 (pink) whereas a bullish breakout above the top places the bearish analysis on hold. A break above the bottom of wave 1 (red circle) invalidates it.
- The main target for the bearish trend is 1.10.
ATHENA EA

BTC/USD Re-Changes Back to Original ABC Pattern
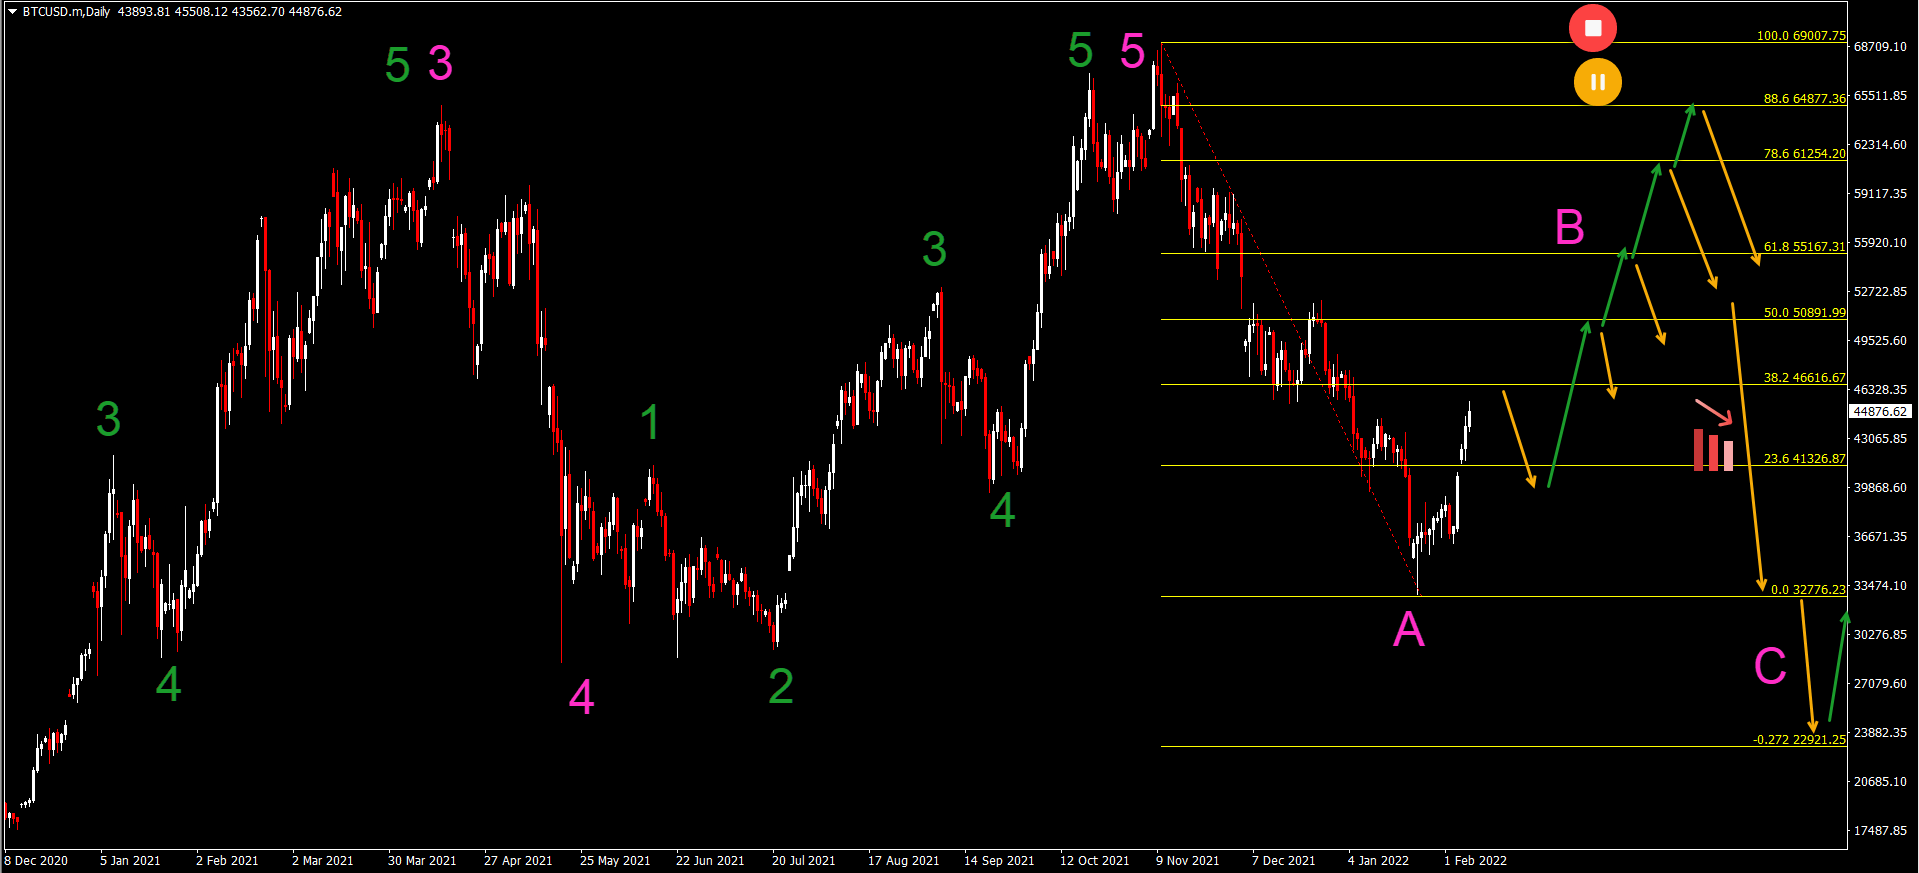
The Bitcoin crypto pair (BTC/USD) seemed to have completed a bearish wave A at the end of January. Last week we decided to make a revision to that Elliott Wave forecast with a wave 4 and then another bearish wave 5. Now the situation is 50-50%:
- At the moment, price action is making a 3 wave pattern upwards – like an ABC or 123 (green). But the 3rd wave is much stronger than the usual wave C and is behaving more like a wave 3.
- If price action completes a 5 wave pattern on lower time frames, then the bearish scenario with a wave 4-5 within wave A (pink) is unlikely.
- In that case, a bullish ABC (gray) pattern is taking place within the expected wave B (pink).
- Any of the Fibonacci retracement levels of wave B (pink) could stop price action from further gains and revert the price action back into a wave C (pink).
A deep bullish push indicates that the previous bottom will probably be the final spot for wave C (pink) whereas a shallow bearish bounce at the 50 or 61.8% Fibonacci level indicates a potential deeper bearish wave C (pink) swing.
GBP/USD Bullish ABC Zigzag Pattern
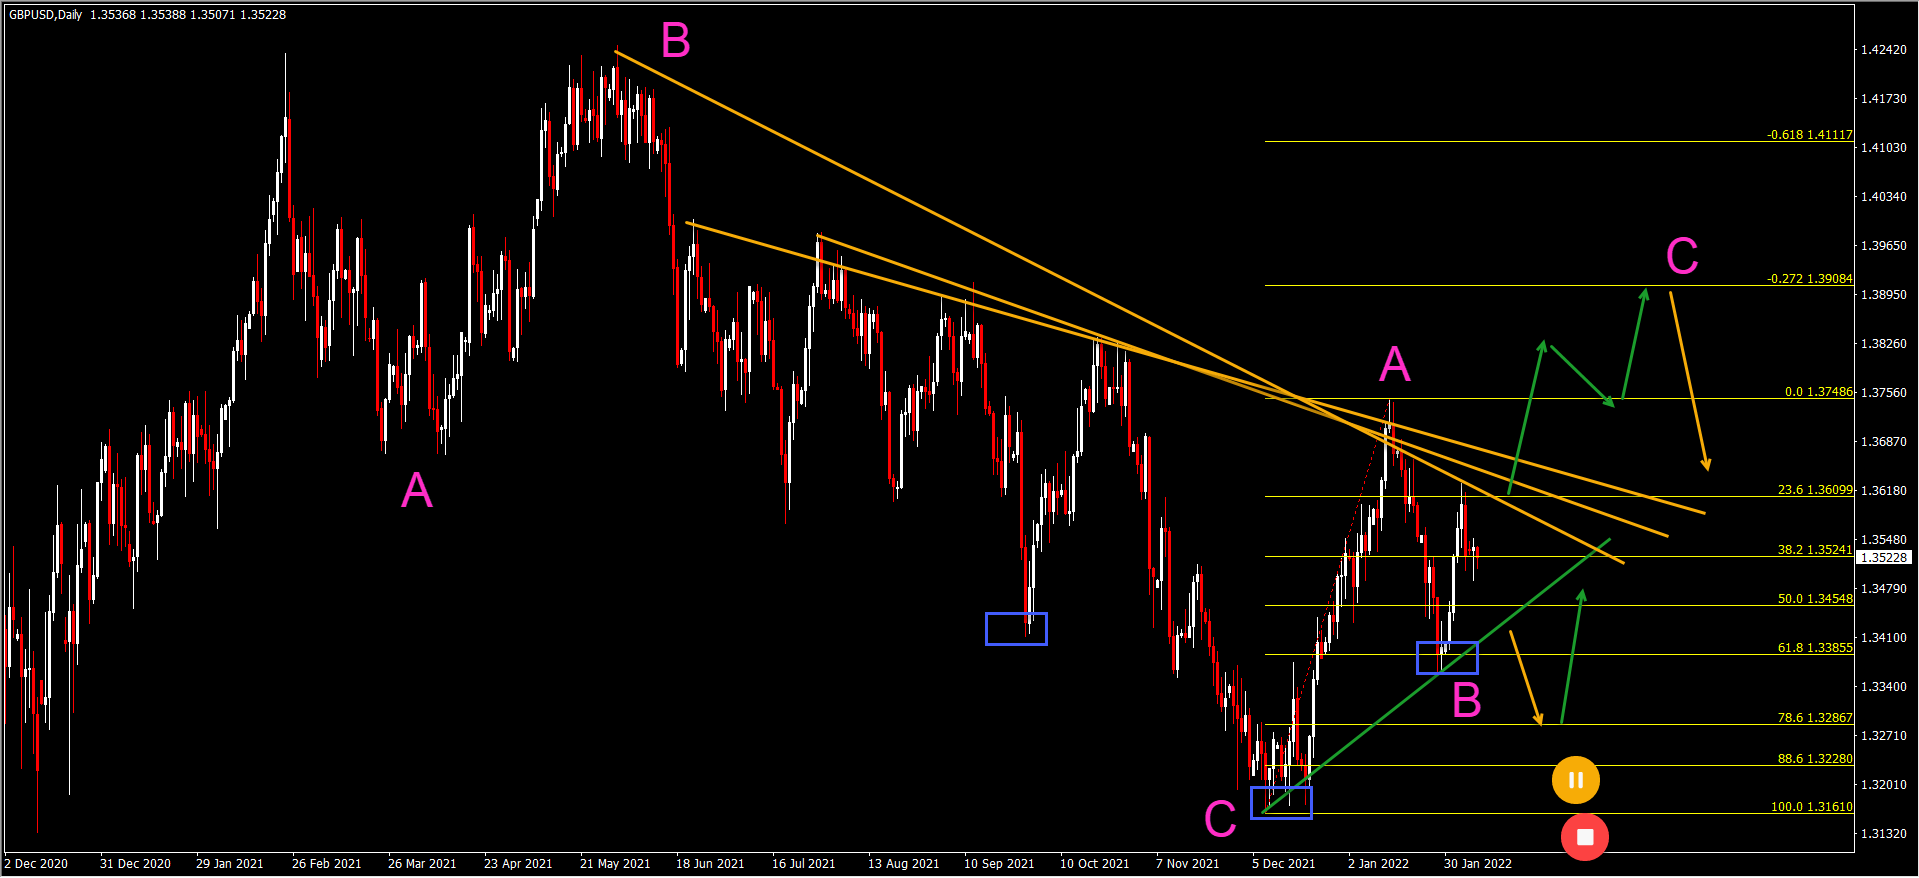
The GBP/USD daily chart made a bullish bounce at the 61.8% Fibonacci retracement level and inverted head and shoulders pattern (blue boxes):
- The strong bullish price swing is probably a wave A (pink). This remains valid as long as price action stays above the bottom (red circle).
- A break below the 88.6% Fibonacci places the bullish zigzag pattern on hold (orange circle).
- The main target is the -27.2% Fibonacci level at 1.39.
- A break above the resistance trend lines (orange) confirms the potential bullish breakout.
- A break below the support trend line (green) indicates a test of deeper Fibonacci retracement levels.
Good trading,
Chris Svorcik


Leave a Reply