Weekly Waves 31 Jan: EUR/USD, Bitcoin and US30
Subscribe
Hi Traders,
our weekly Elliott Wave analysis reviews the EUR/USD, the Bitcoin crypto currency, and the US30 stock market.
Our outlook has become a little more bearish on all 3 instruments – although a bullish correction is expected to emerge after the bearish swing is completed.
EUR/USD Downtrend Resumes Towards 1.10
The EUR/USD made the bearish breakout below the support trend lines (dotted green) as mentioned in last week’s Elliott Wave analysis:
- The bearish momentum showed decent strength and is likely a wave 3 (red) price swing. The bullish correction is expected to be a choppy wave 4 (red).
- The wave 4 usually retraces to and bounces at a shallow Fibonacci retracement level such as the 38.2% Fib (or 23.6% and 50%).
- An unexpected bullish breakout above the resistance (orange box) places this wave 3-4 analysis on hold (orange circle). A deep push higher (red circle) invalidates it.
- A bearish continuation (orange arrows) is expected to aim at the target zone around 1.10.

ATHENA EA

BTC/USD Changes to Wave 4 Pattern
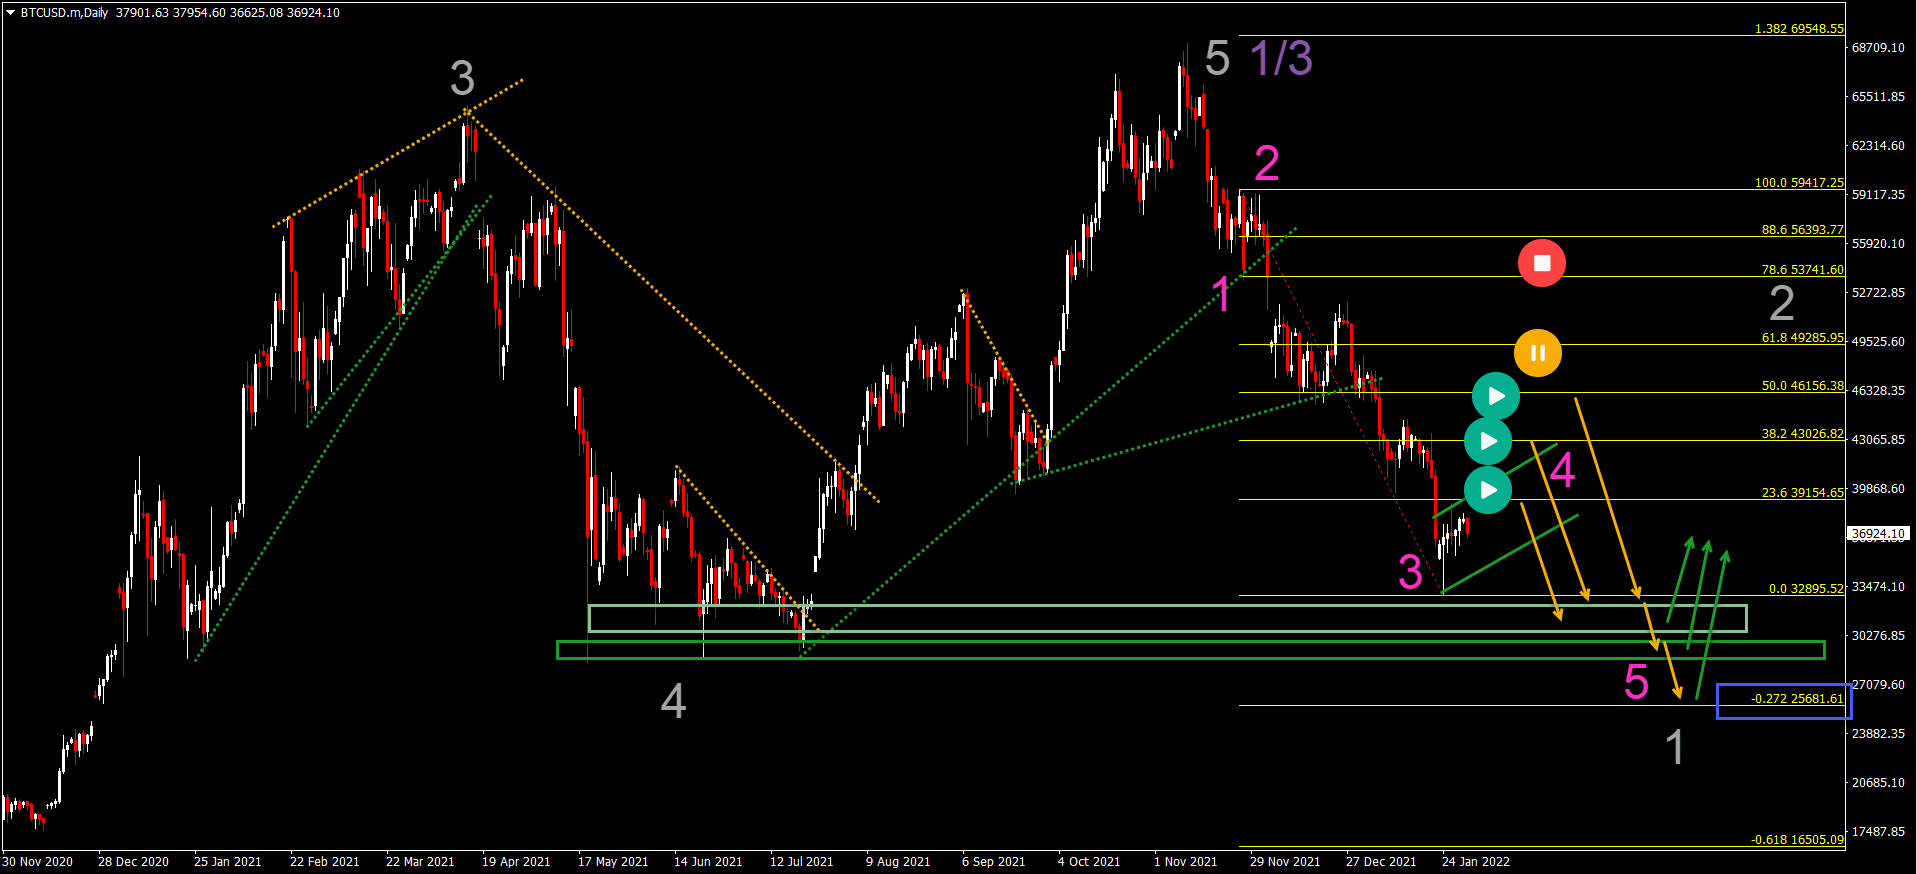
The Bitcoin crypto pair (BTC/USD) seemed to have completed a bearish wave A last week. But this week we decided to make a revision to that Elliott Wave forecast. Here’s why:
- The bullish correction has been relatively slow and choppy. Price action made a retracement only up to the 23.6% Fibonacci retracement level so far.
- Therefore, price action could easily be in wave 4 (pink) correction of a larger wave 1 (grey) – as long as price action remains below the 50% Fibonacci level.
- A deep bullish push places the Elliott Wave analysis on hold (orange) or invalidates it (red).
- A bullish bounce is expected at the Fibonacci target or support areas (green boxes) due to the end of the wave 1 (grey) and the start of the wave 2 (grey).
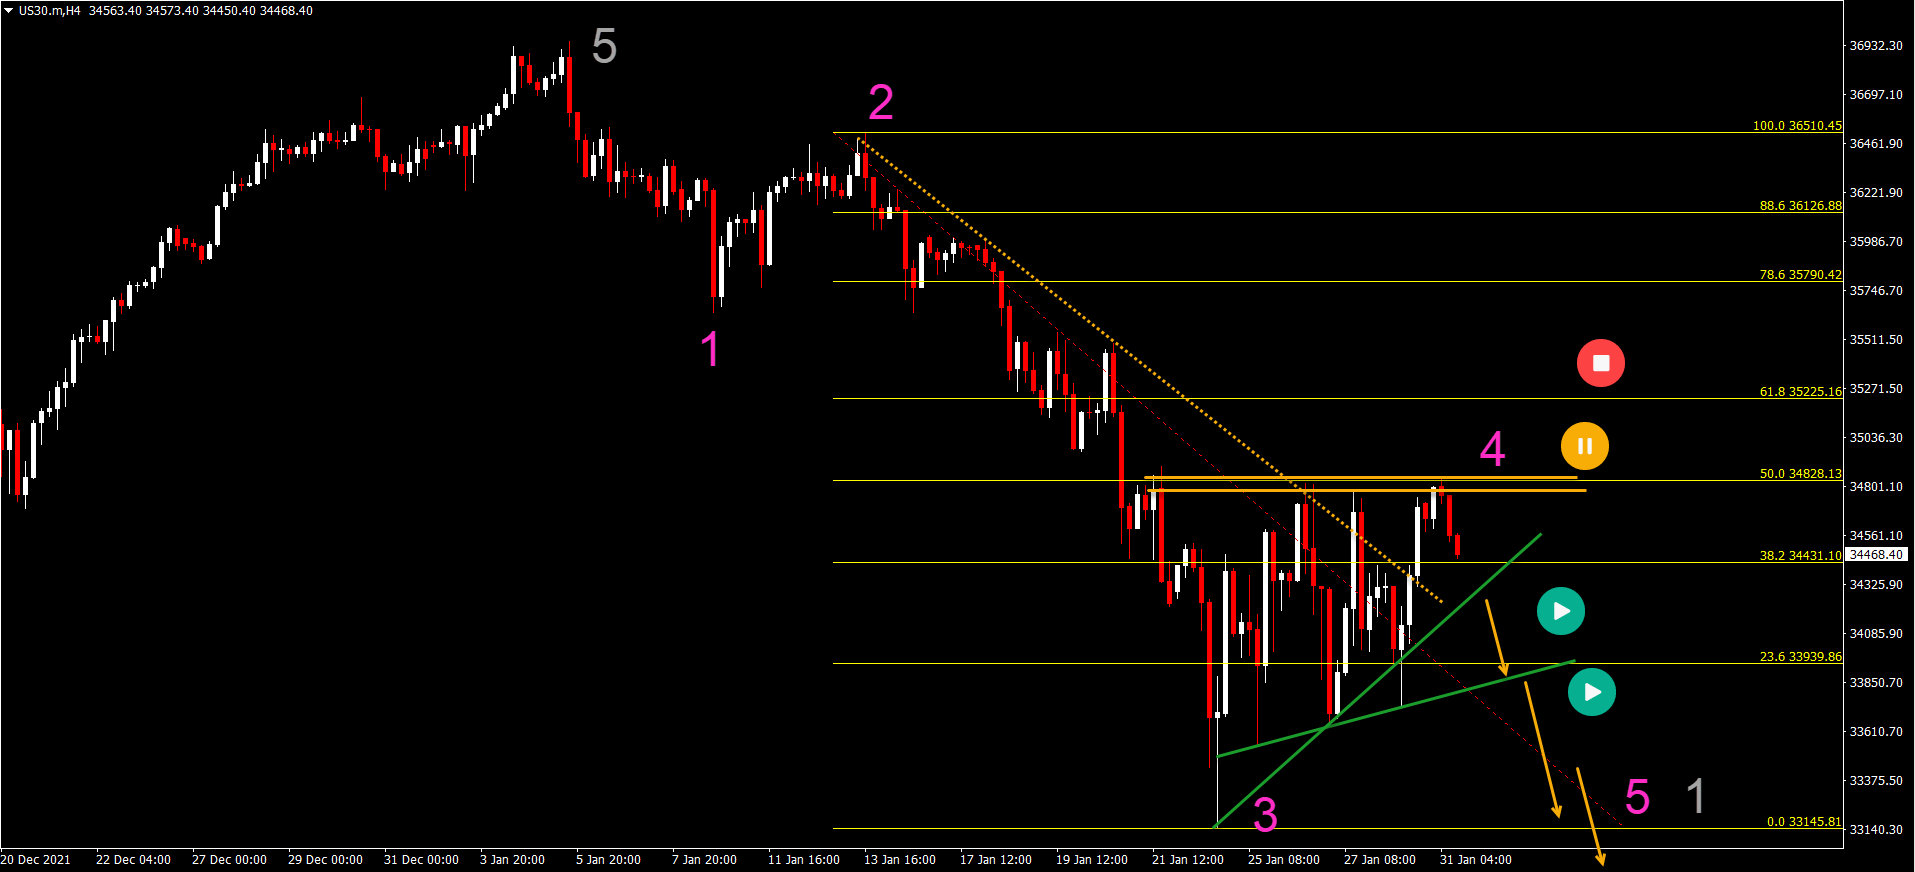
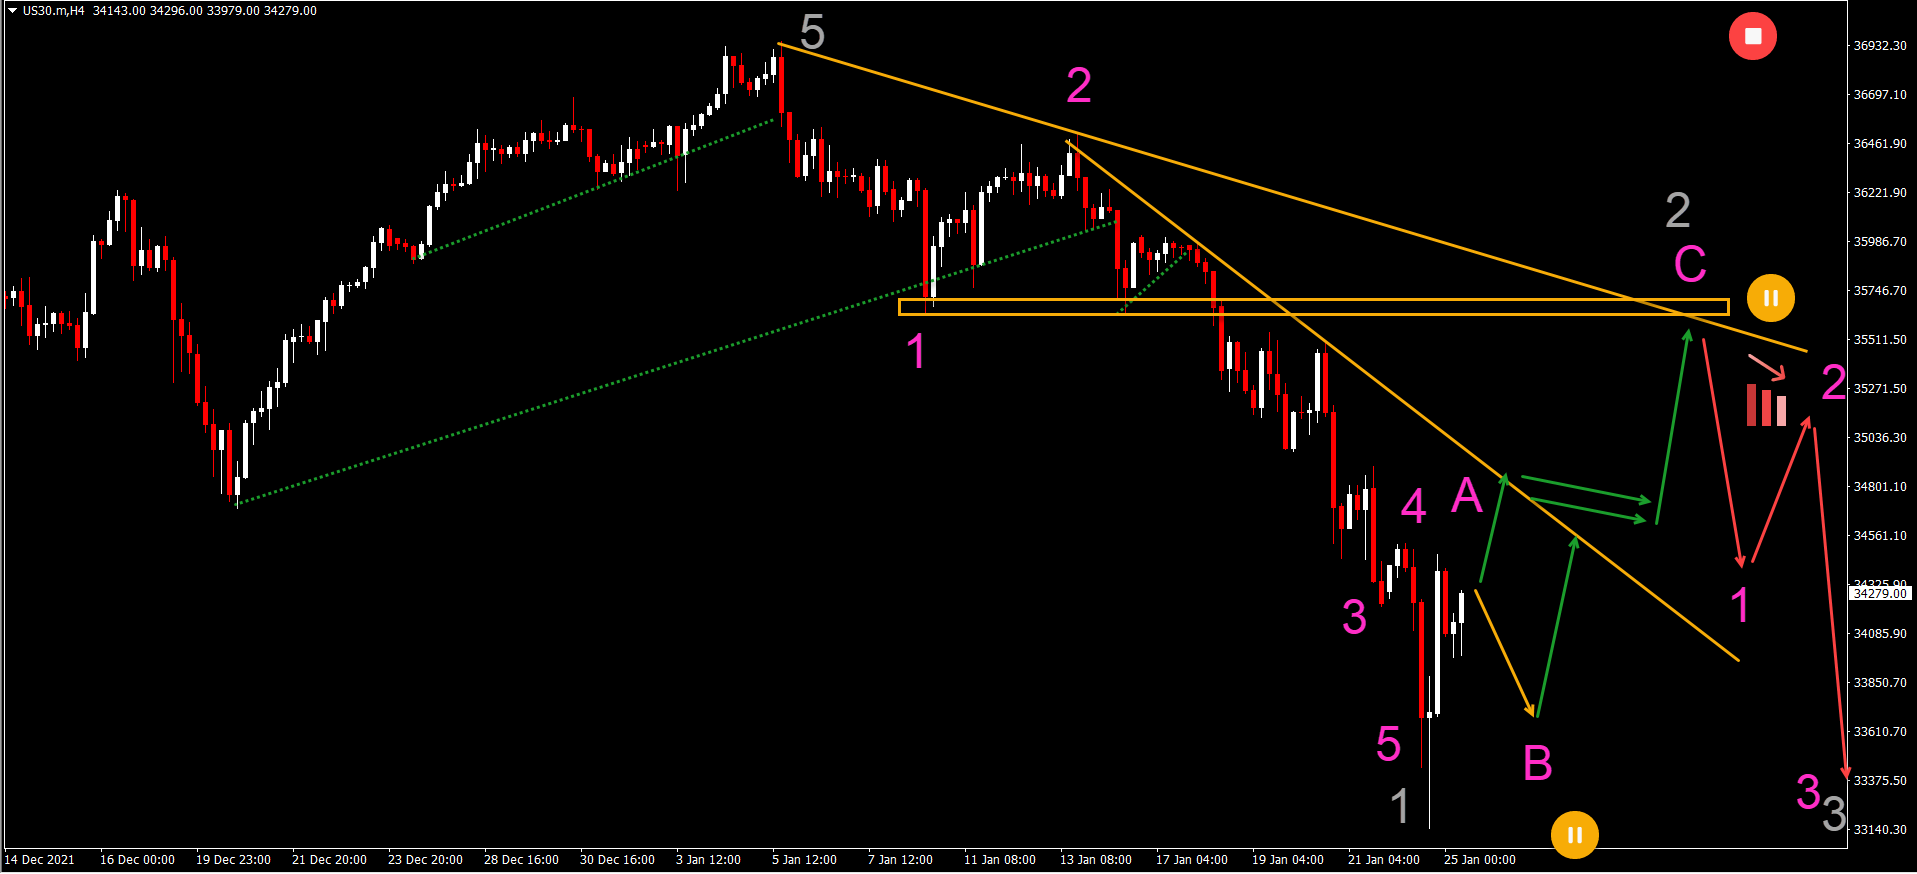
US30 Choppy Pattern Remains a Weak Signal
The US30 chart is also showing bullish weakness. The choppy and corrective pattern indicates that the bulls were unable to retake control at a support zone:
- Price action has respected the 50% Fibonacci resistance retracement level three times in a row. The triple top could indicate a wave 4 (pink) pattern.
- A bearish breakout below the support trend lines (green) could indicate a continuation of the downtrend (orange arrows).
- A bullish breakout would make it more likely that the bearish swing is not a wave 3 (pink) but rather the end of a wave 5 of wave 1 or wave A.
Good trading,
Chris Svorcik


Leave a Reply