🔥 Nasdaq Chart Sends Bearish Warning after Engulfing Twins 🔥
Dear traders,
the Nasdaq 100 (NQ) stock index is struggling at the 50% Fibonacci retracement level. The bearish daily candle also shows a bearish engulfing twin candlestick pattern. Will the NQ make a larger reversal?
Price Charts and Technical Analysis

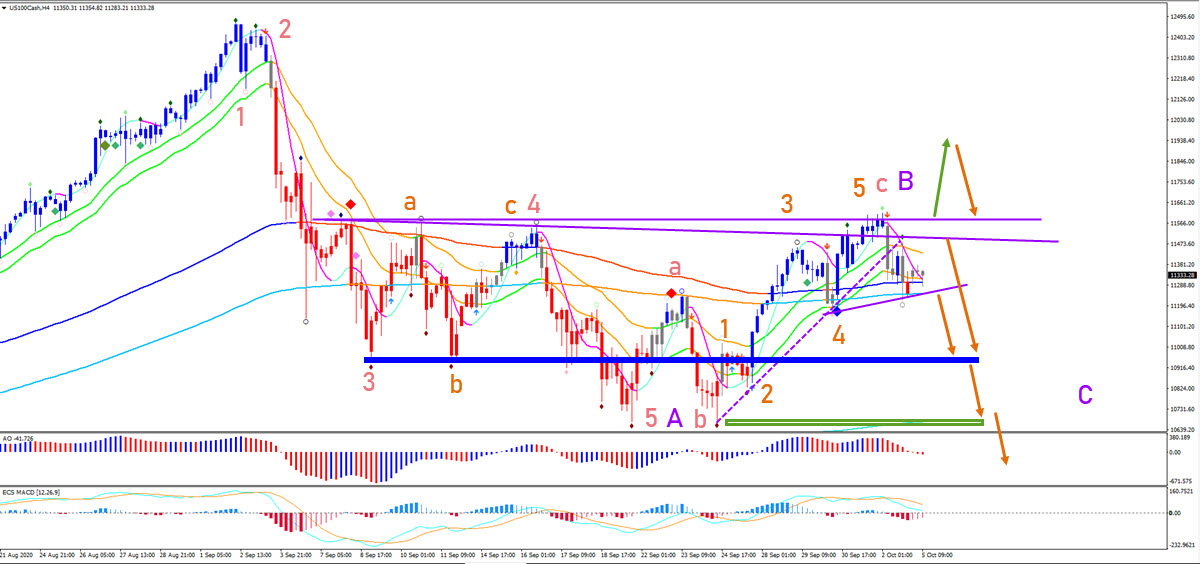
In our eyes, a bearish retracement has the best odds at the moment. There are multiple aspects that give the bears an upper hand at the moment. The Nasdaq also confirmed a bearish turn on the ecs.MACD (red diamond). The bearish drop was impulsive and also clearly broke below the 21 ema support zone. This makes it more likely that a bearish ABC (purple) pattern is unfolding. What would confirm this outlook? The key support zone is the bottom of the 21 ema and the previous support levels (blue box). A bearish breakout below that should send NQ towards the Fibonacci targets within wave C (purple). Only a break above the previous tops (red lines) could start a push up.
The 4 hour chart is showing good evidence of a completed wave 5 (orange) of wave C (red) of wave B (purple). But the price action does need to break below the support Fractals at the long-term moving averages (purple) line. Also a retest of the previous resistance could indicate a bearish bounce and turn down. The support zones (blue and green boxes) also remain key levels to break.
The analysis has been done with the indicators and template from the SWAT method (simple wave analysis and trading). For more daily technical and wave analysis and updates, sign-up to our newsletter.
Good trading,
Chris Svorcik


Leave a Reply