? EUR/USD Bearish 1.12 Rejection but Triangle Remains Intact ?

Dear traders,
the EUR/USD is (again) stuck in a triangle chart pattern for the moment. A bearish reversal has a small edge but ultimately the breakout remains the key criteria.
EUR/USD
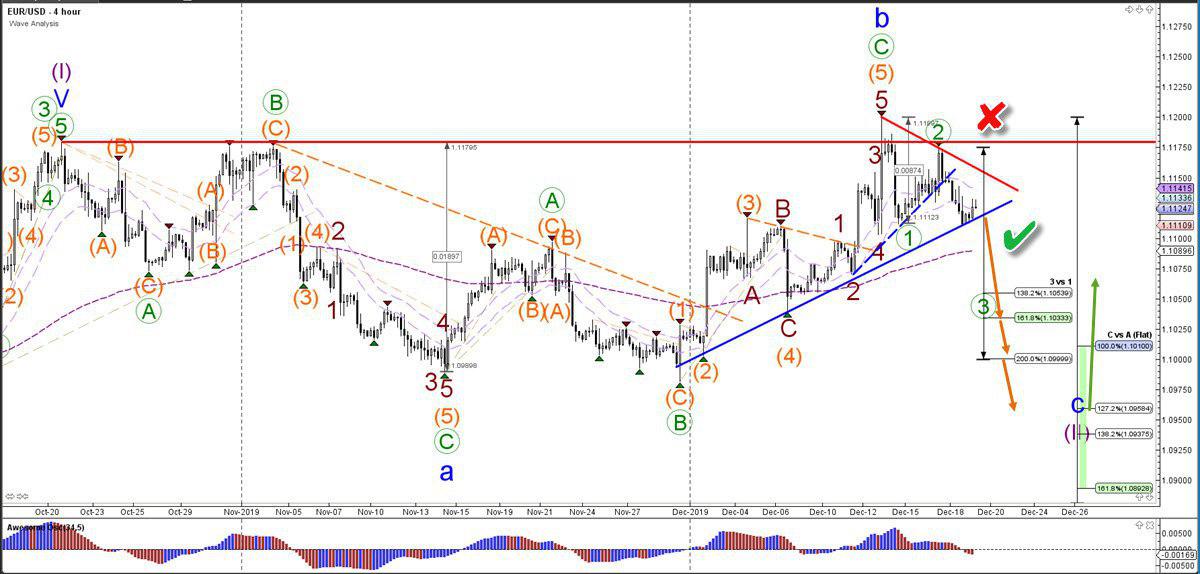
4 hour
The EUR/USD bearish rejection at the previous top (red line) makes it most likely that price has completed a wave C (green) of wave B (blue) at the recent high. But price action will need to confirm (green check) the reversal by clearly breaking below support (blue line) and the 144 ema close. Otherwise if price is able to break above 1.1180, then this bullish impulse could invalidate (red x) the bearish wave outlook. A bearish breakout aims for Fibonacci targets whereas an upside push could aim for 1.1250.
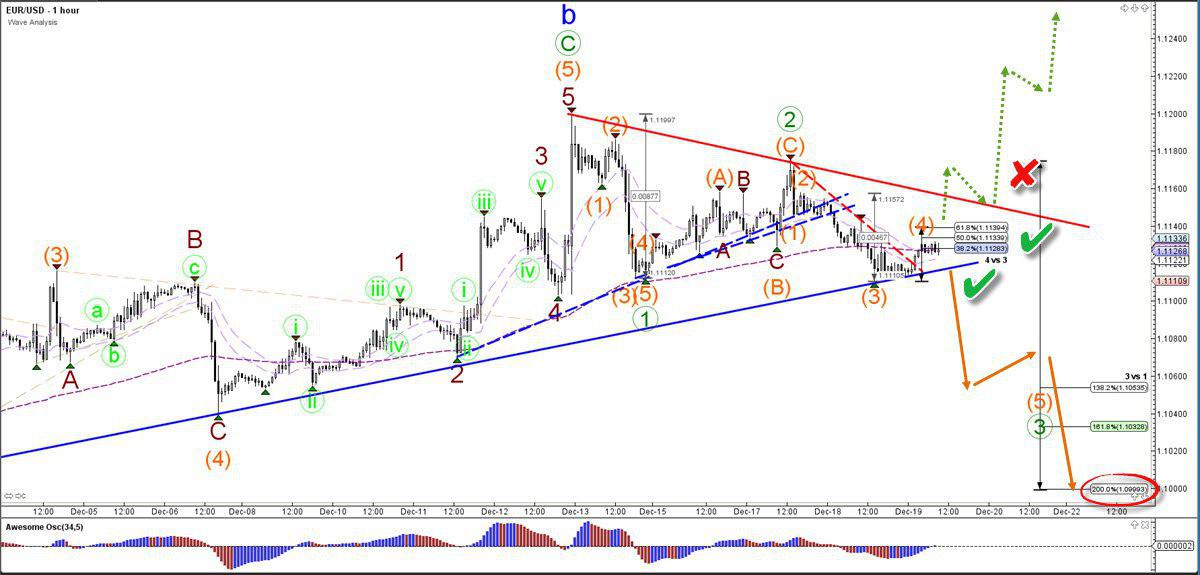
1 hour
The EUR/USD is potentially building a 123 (green) wave pattern but price will need to break (green check) below support (blue line) and stay below the previous top, otherwise the wave 2 (green) becomes invalidated (red x).
For more daily wave analysis and updates, sign-up up to our ecs.LIVE channel.
Good trading,
Chris Svorcik
Elite CurrenSea


Leave a Reply