? AUD/USD Bearish ABC Pattern Aims at 0.6750 Support ?
Subscribe

Dear traders,
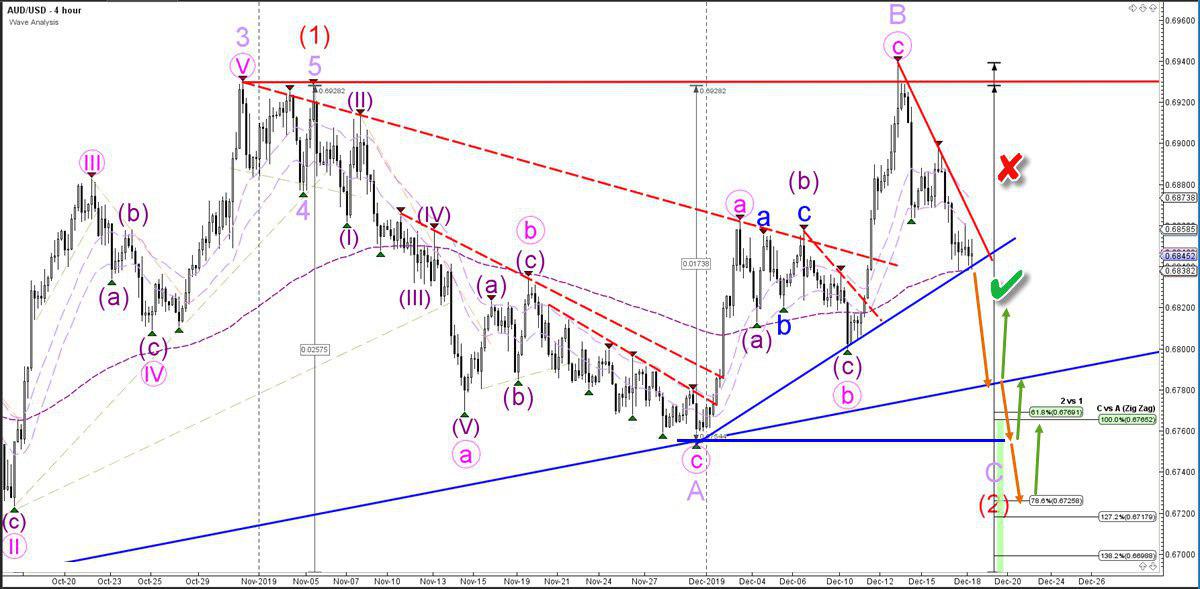
the AUD/USD made a bearish bounce at the previous top (red), which has created a double top chart pattern. How far will the AUD/USD reverse?
AUD/USD
4 hour
The AUD/USD is expected to decline further due to the potential ABC (light purple) wave pattern. A bearish breakout below support (blue line) could confirm (green check) the continuation within the wave C (light purple) towards the previous bottom. The next support layers could provide a bullish bounce as price completes potential wave 1-2 (red).
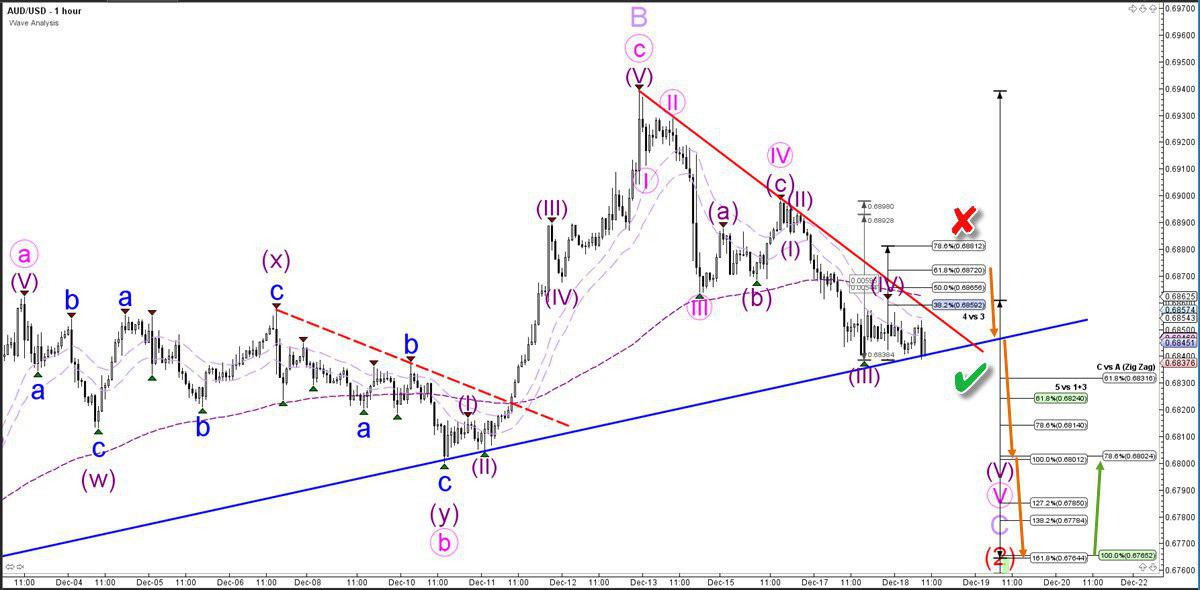
1 hour
The AUD/USD is in a potential wave 4 (purple) as long as the price stays below the Fibonacci retracement levels of wave 4 vs 3, otherwise this pattern becomes invalidated (red x). A bearish breakout could confirm (green check) the push lower as expected towards the Fibonacci retracement targets.
For more daily wave analysis and updates, sign-up up to our ecs.LIVE channel.
Good trading,
Chris Svorcik
Elite CurrenSea


Leave a Reply