❗️ USD/JPY Again Retesting 110 Resistance & Key Decision Zone ❗️
Subscribe
Dear traders,
the USD/JPY is testing the previous resistance levels (red lines) around 109.50-110, which is a key decision zone for a bullish breakout or bearish bounce.
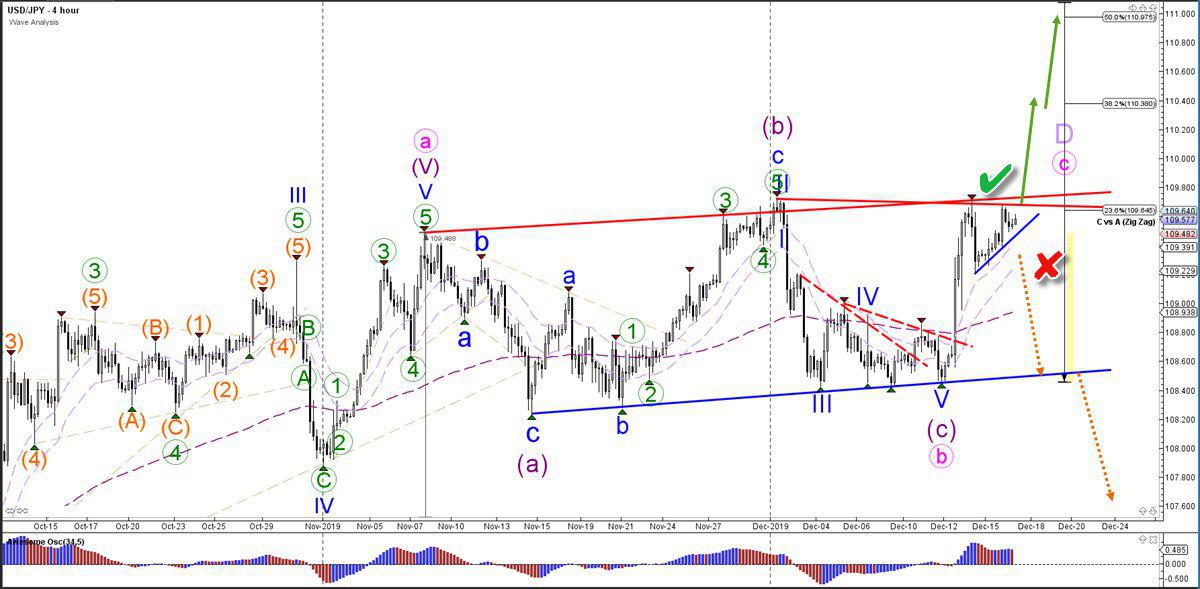
USD/JPY
4 hour
The USD/JPY break above the resistance (red) would confirm (green check) the bullish wave outlook. Price is expected to aim for the Fibonacci targets of wave C vs A to complete a wave D (light purple) of a larger triangle pattern. A bearish breakout invalidates (red x) the wave pattern and indicates more downside.

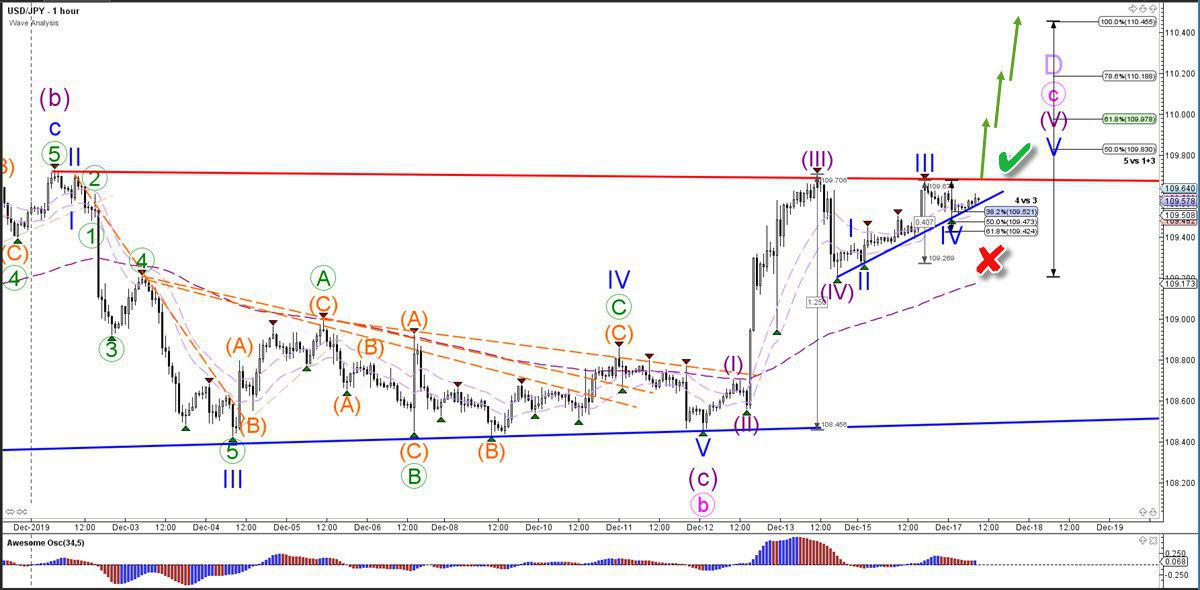
1 hour
The USD/JPY is testing the Fibonacci retracement levels of wave 4 (blue) vs 3. A bullish bounce that stays above the 61.8% Fib level could indicate an uptrend continuation (green check) whereas a break below the 61.8% Fib invalidates (red x) the wave 5 wave (blue) pattern.

For more daily wave analysis and updates, sign-up up to our ecs.LIVE channel.
Good trading,
Chris Svorcik
Elite CurrenSea


Leave a Reply