? USD/JPY Pullback in Uptrend after Hitting 108 Target ?
Subscribe
Hi traders,
the USD/JPY bullish momentum has created a steep uptrend channel which almost reached the 261.8% Fibonacci target. A break below the channel could indicate a bearish retracement within the uptrend.
USD/JPY
4 hour
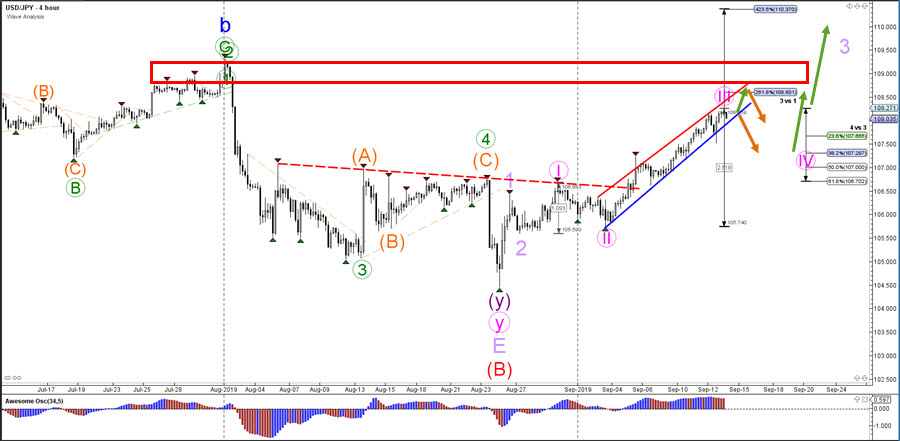
The USD/JPY seems to moving higher within a wave 3 (pink) impulse and one more push higher could see price hit the 261.8% Fibonacci target of wave 3 vs 1. A mild correction however could be expected completed as the price reaches a daily resistance zone (red box). The Fibonacci retracement levels of wave 4 vs 3 are expected to act as support and could become a bouncing spot for an uptrend continuation.
1 hour
The USD/JPY uptrend is aiming for the Fibonacci targets of the wave 5 vs 1+3 but a break below the support trend line (blue) could indicate a bearish correction first. The main support zone for a trend continuation could be the 107.50 round level, after which the uptrend could aim for round levels such as 109 and 110.

For more daily wave analysis and updates, sign-up up to our ecs.LIVE channel.
Good trading,
Chris Svorcik Elite CurrenSea


Leave a Reply