? S&P500 Breaks above ABCDE Triangle and 21 EMA Zone ?
July 17, 2018
2 min read
Subscribe
Hi traders,
The S&P500 is showing a bullish breakout. Price is breaking away from the 21 ema zone which often indicates strong momentum.
S&P500
Week
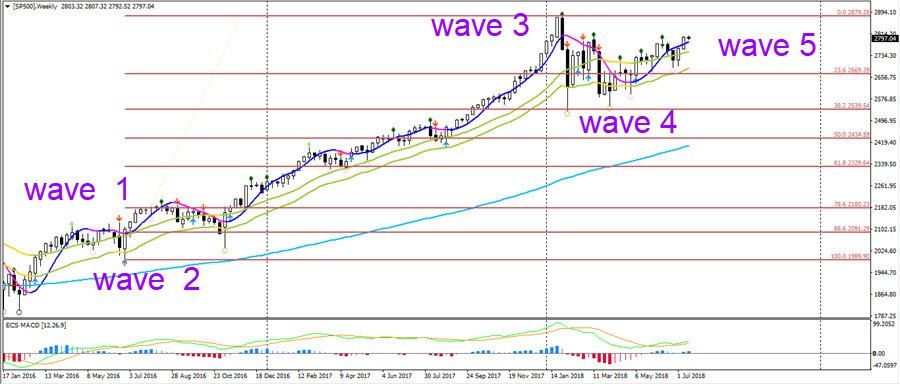
S&P500 is also showing a bullish HMA and green diamond fractals which all confirm an uptrend. Price also bounced at a very shallow 38.2% Fibonacci level which probably confirms a wave 4.
Day
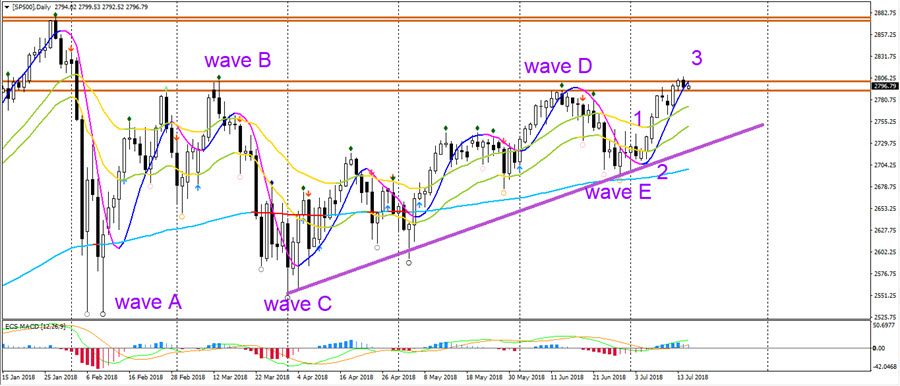
The daily chart could indicate the end of a triangle chart pattern. Price seems to have completed an ABCDE wave because price has broken above the top of wave B. This could be a new bullish wave 3 but a pullback could occur to the 21 ema zone on the daily chart, which could be an interesting area for entries. Eventually a bullish continuation is expected.
Good trading,
Chris Svorcik
Elite CurrenSea


Leave a Reply