? GBP/USD Challenges Resistance Fib Levels of Wave-4 ?
Subscribe
Hi traders,
The GBP/USD stopped its bearish momentum at the support (blue) trend line of the downtrend channel, which is a new decision zone for a breakout or bounce.
GBP/USD
4 hour

The GBP/USD has reached the 78.6% Fibonacci target. A bearish breakout could see price fall below the channel towards the 100% Fibonacci target whereas a strong bullish bounce could indicate the end of the wave C (green) pattern.
1 hour
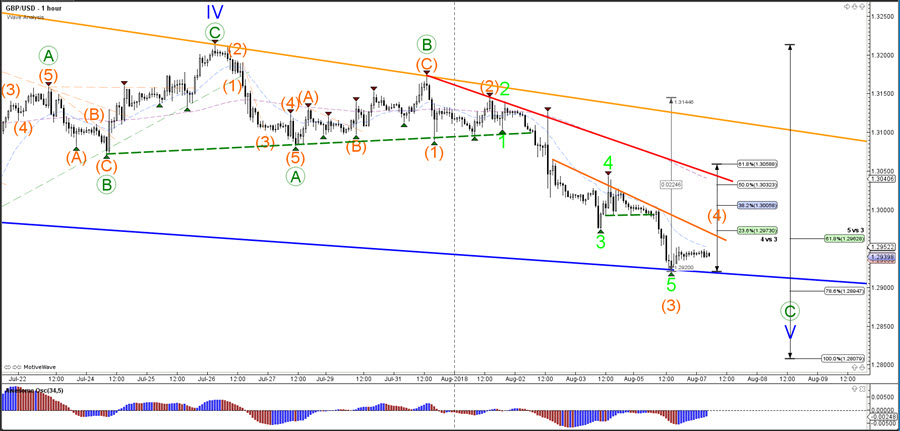
The GBP/USD is probably building a bullish wave 4 (green). This wave pattern remains valid as long as price stays below the Fibonacci levels of wave 4 vs 3. A bearish breakout below the support trend line (blue) could see a wave 5 develop to complete potential wave C (green). A break above the 50% Fibonacci level makes a wave 4 (orange) less likely.
Good trading,
Chris Svorcik
Elite CurrenSea


Interesting reading of your 4H chart. Wave 1 & 3 are ABC patterns! While 1,3 & 5 are impulse and ABC are corrective! Could it be that 1 & 3 are three wave patterns the message you are putting across? Pls note early signs of Bullish dvgce on the 4h chart oscillator. But there is still a little more downside to come I think.
Hi Morris, thank you for the feedback. Nice to hear from you. 🙂 yes in this case, waves 1-3-5 are marked as ABC too because its a potential ending diagonal pattern within wave 5. A break below the 100% Fib target around 1.28 invalidates that ending diagonal pattern and a bigger bearish momenum is then likely.