GBP/USD ?? Approaching U-Turn Zone
Subscribe
The GBP/USD is approaching critical price levels and swing completion. The potential for a significant bearish turn is becoming heightened.
This analysis will offer an alternative perspective on the GBP/USD
Complex Correction Cold be Completing
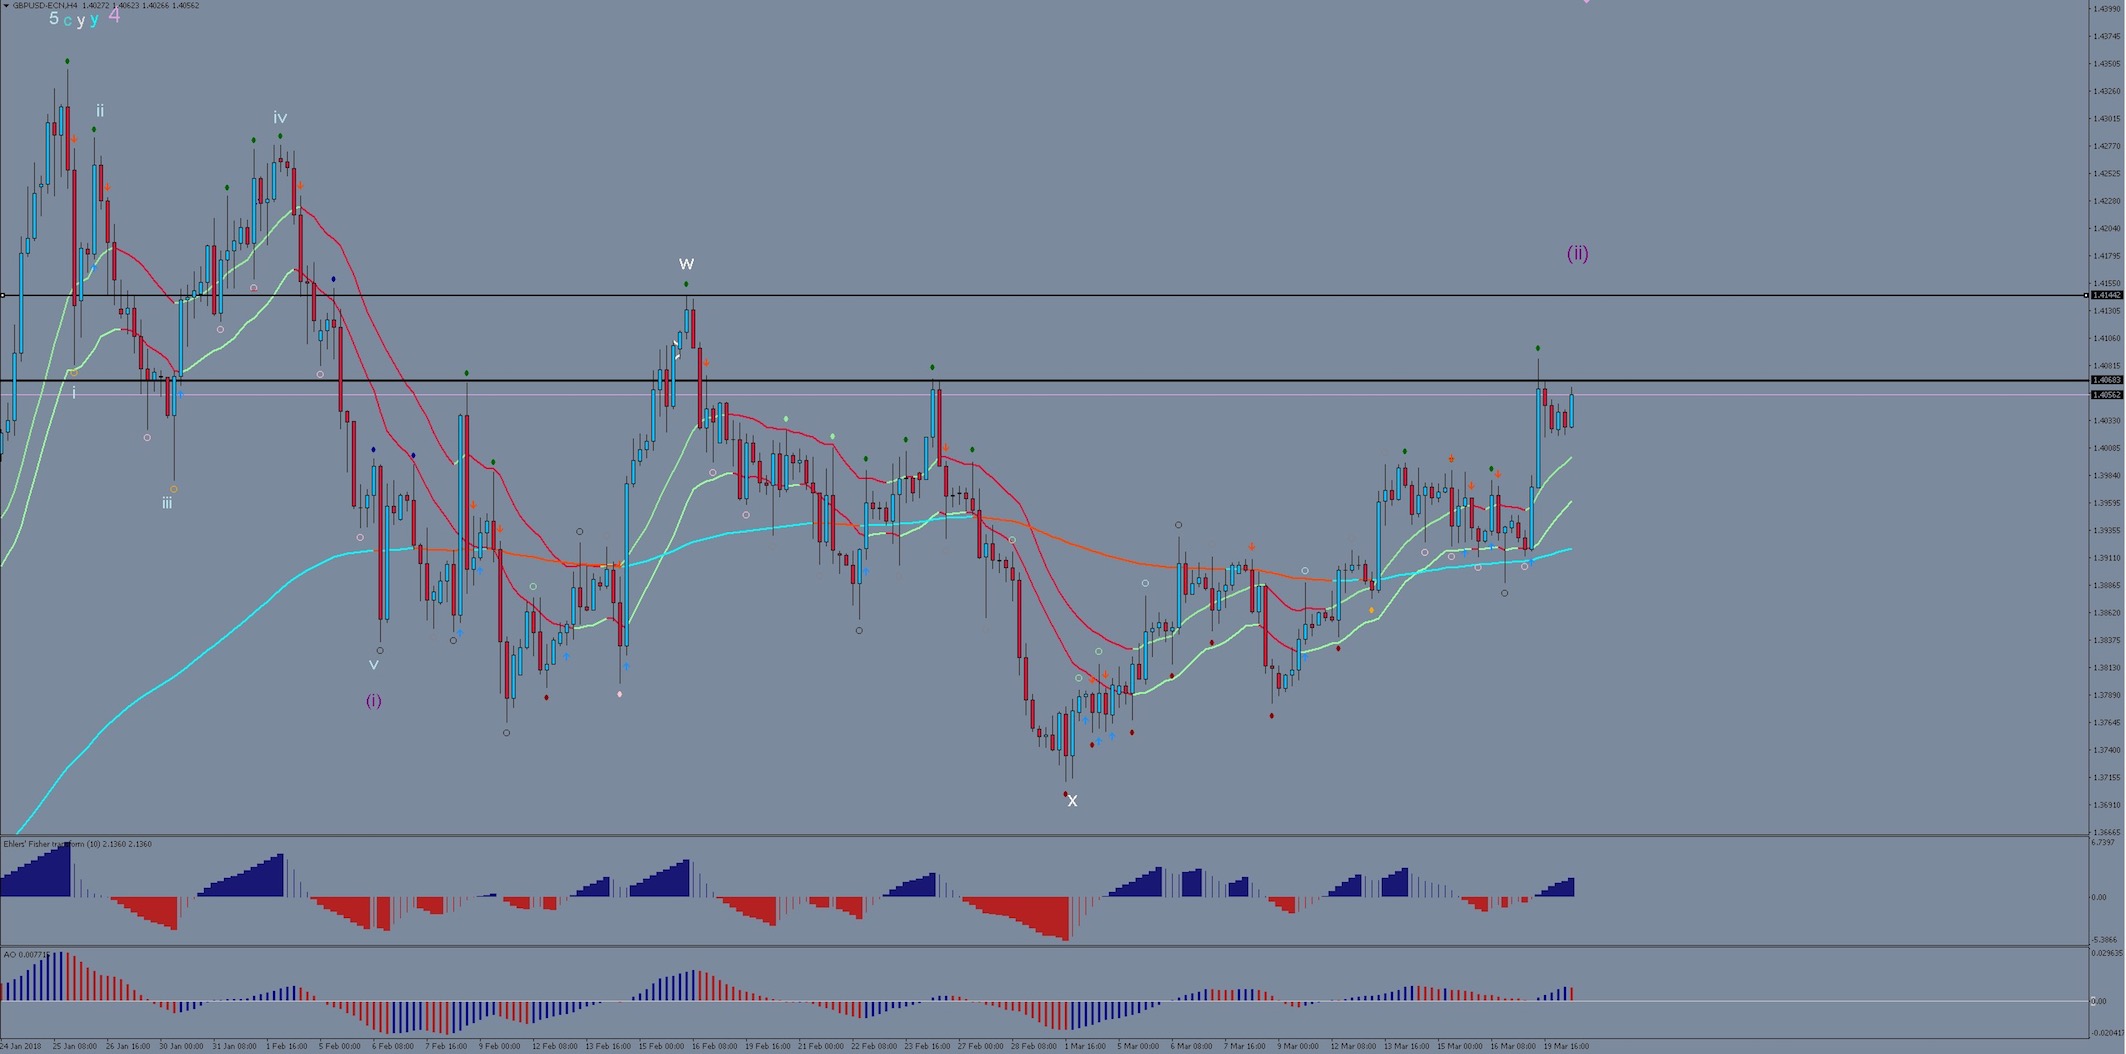
The Cable is now approaching highly significant resistance levels. The chart above shows a bearish wave count scenario which implies that a downtrend may have started already and that we have seen a complex sideways correction as part of wave (ii) since Feb 2. Although the swing since Mar 1 is looking fairly bullish, it is at the same time also giving the impression of being corrective as well. Price shot over the resistance at 1.4068 yesterday and is in the process of being cracked properly today. The real test will come at 1.4145 as this level would be the same as the end of wave W in the above wave count and could be a potential completion level for wave (ii). A strong and swift fall would need to set in quickly to confirm this analysis.
Aggressive traders could consider taking bearish candlestick pattern bounces at 1.4145 or alternatively wait for a break of the 4 hour chart 21 EMA.
There are many interim targets for a trade like this because the ultimate long-term target could lie below the bottom of 2016, i.e. sub 1.1890 in order to complete a larger degree Wave 5!
All the best along your trading journey
Hubert
.


Leave a Reply