? EUR/USD Long-Term Wave Analysis 12 Nov ’18 ?
Subscribe
Hi traders,
The EUR/USD failed to break above the resistance trend line (red) and is now testing the previous bottom again. A double bottom occurred the previous time price approached the key 1.13 support zone.
EUR/USD
Daily
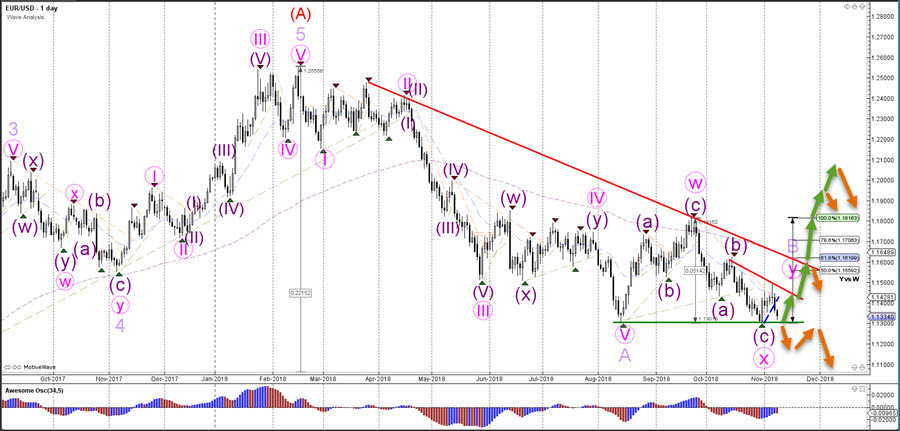
If the EUR/USD makes a bullish bounce at the 1.13 support zone, price could see a move up to test the Fibonacci retracement levels of wave Y vs W. A bearish breakout, however, with a daily candle close below 1.13 could indicate the end of wave B (purple) and a downtrend continuation via wave C (purple).
Weekly

The EUR/USD is expected to expand the bullish correction within wave B (purple) unless price breaks below the support zone (green).
Monthly
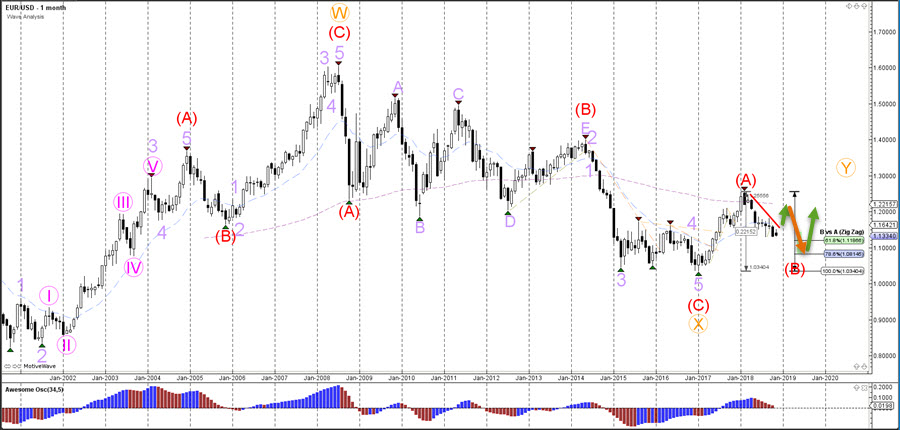
The EUR/USD bearish ABC pattern that is visible on the weekly chart (purple) is probably part of a wave B (red), which is a bullish ABC zigzag pattern. This wave outlook is valid as long as price bounced at the 61.8% or 78.6% Fibonacci levels of wave B vs A. Otherwise a different market structure could be valid and a larger downtrend could take place.
For more daily wave analysis and updates, sign-up up to our ecs.LIVE channel.
Good trading,
Chris Svorcik
Elite CurrenSea


Leave a Reply