What’s Happening with the Indecisive and Choppy US Dollar
Subscribe
Dear Traders, have you also noticed how slow and corrective the US Dollar (USD) currency pair is moving recently?
This article will not only explain why the USD is moving so cautiously but also analyse what we expect in the next weeks. Make sure to read this update if you want to know more about the (hidden) patterns and psychology behind the market. (video of this articles is at the bottom)
Bearflag in Strong Downtrend Channel
The daliy chart chart is offering a clear and well developed bearish trend channel, which is indicated by the red trend lines.
Here are the most important aspects for this channel:
- Connects 3 resistance points and 2 support levels
- Offers a well balanced and sustainable trend angle.
- Show bearish momentum and bullish corrections.
Most pullbacks did not manage to retrace beyond the short-term moving average (bearish orange MA), which has acted as a resistance zone for the bearish trend.
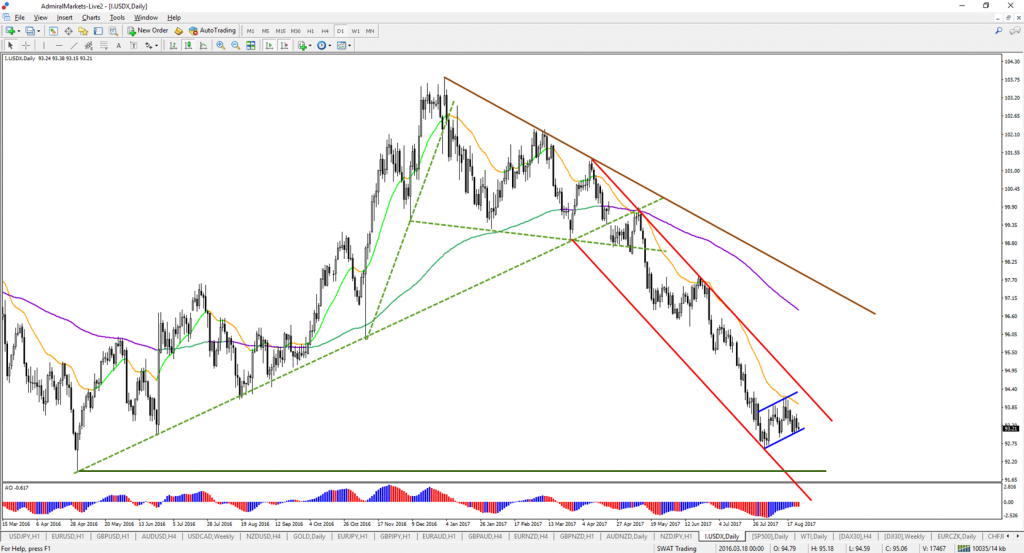
The current US Dollar bullish retracement is indicated by the blue trend lines, which is a bullish channel. The angle of the channel is showing a very mild angle which makes it a likely bear flag chart pattern. Such a flag is a bearish continuation signal, especially when considering the fact that there is no divergence pattern visible (hence no weakness of the trend as yet).
Question: so why has the US Dollar been so choppy during August?
Blame it on the the bear flag! These corrective patterns are well known for their slow and indecisive price action….
Question: what can we expect next?
The US Dollar will remain a slow moving currency pair as long as price stays in this choppy bear flag channel… price will need to break before traders can expect more action:
- Bullish break above the bearish trend channel for a bullish reversal.
- Bearish break below the bearflag chart pattern for dowtrend continuation.
.
Bearish Breakout within Wave 4-5 Pattern
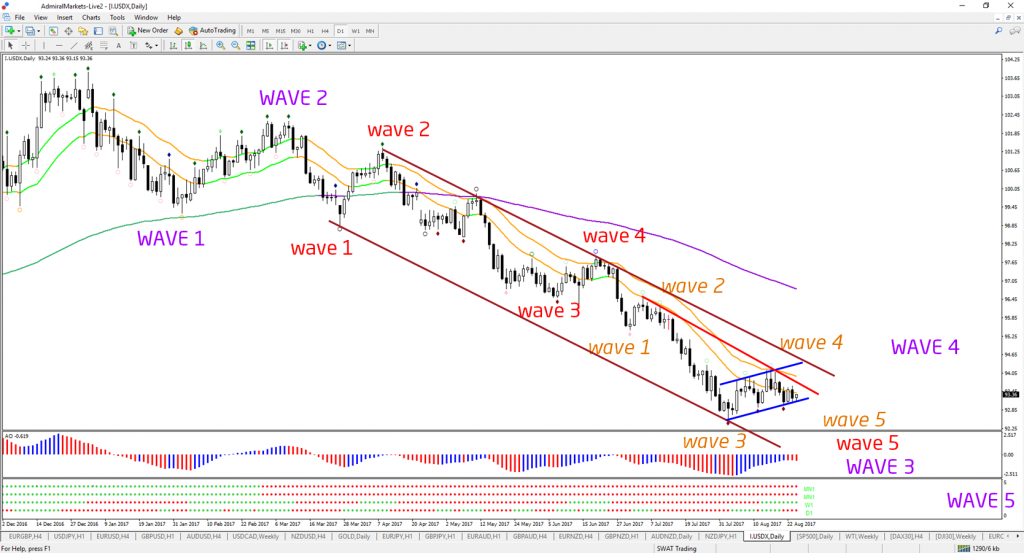
A bearish break seems most the most likely scenario when analysing the market structure. Factors such as bearish momentum, bearish channel and lack of divergence all strengthen the case of the bears. Also wave patterns confirm the bearish pressure on the US Dollar.
Here is how we see the wave patterns:
- The two strong bullish retracements near the top are counted as two wave 1-2’s (purple/red).
- The current bear flag is a perfect wave 4 correction.
- The wave 4 correction is probably an internal correction within a larger wave 5 (red) of wave 3 (purple).
The next step is to use the Fibonacci retracement tool to locate where the wave 4 might end:
- We are looking for a bearish bounce at the Fibonacci levels of wave 4 versus wave 3 (orange).
- So far, the 38.2% Fibonacci retracement level has already provided resistance for a bearish turn.
The map is starting to look more clear… It’s time to review potential trade setups.
Short Setups on US Dollar
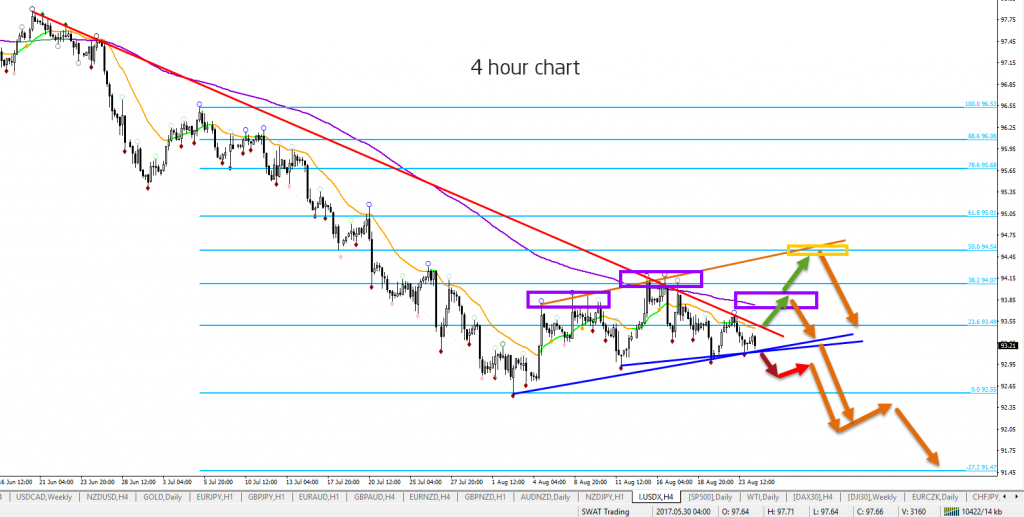
Lsat but not least, time to discuss short entries. There are a few potential trade setups that are based on the 4 hour chart. Let’s review them one by one:
- The bearish break below the bear flag ( dark red arrow).
- The pullback after the break (red arrow).
- A bearish bounce at the right shoulder of a head and shoulders pattern (right purple box).
- A bearish bounce at the 50% Fib and resistance trend line (orange box).
The first target is the -27.2% target at 91.47. I am not looking to take any longs on USD strength unless price breaks above resistance trend lines and the 50% Fib.
Conclusion:
- Expecting and waiting for more US Dollar weakness – sooner or later.
- This means that EUR/USD should make – at least – one more leg up.
- Waiting for a break of the bear flag to confirm the bearish signal.
Many green pips,
Chris Svorcik
More info on our ecs.SWAT course and trading system
Twitter: @EliteCurrenSea
YouTube: Elite CurrenSea


Leave a Reply