USD/CAD is in Bullish Correction in the Medium Term
Subscribe
Dear Trader,
Are you curious about the recent USD/CAD bearish run but bulllish retracement?
In today’s article we will discuss the Elliott wave structure of USD/CAD in the medium term.
Correction Phase after Strong Bearish Price Action
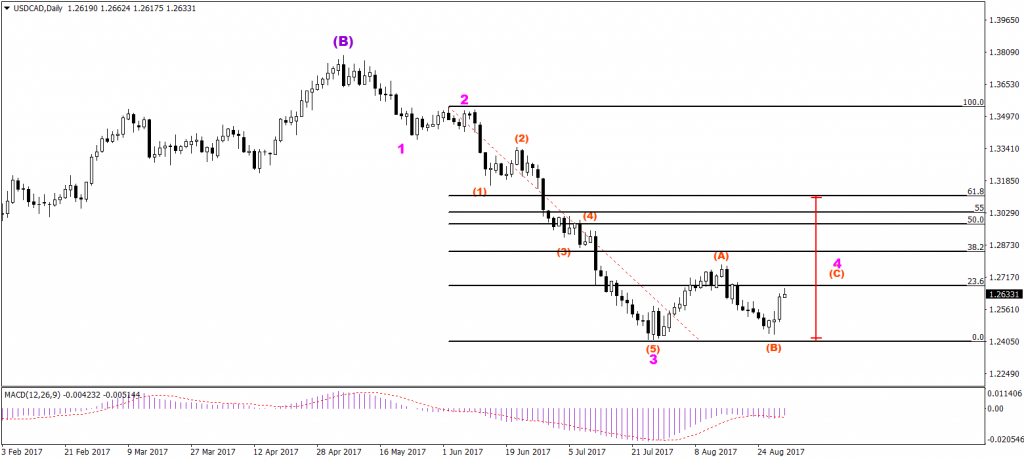
As we can see in the chart below, price is halting after a strong bearish move… Let’s analyse on the Elliot Wave structure first of all:
- Red wave cycle may have completed a 12345 pattern (red).
- This could be part of a larger wave 3 (pink).
At the moment price is in bullish correction phase where we have wave A (red) and B (red) completed.
Wave B stopped at a deep 88.6% Fibonacci level, where price bounced at support and showed its ability to start wave C (red).
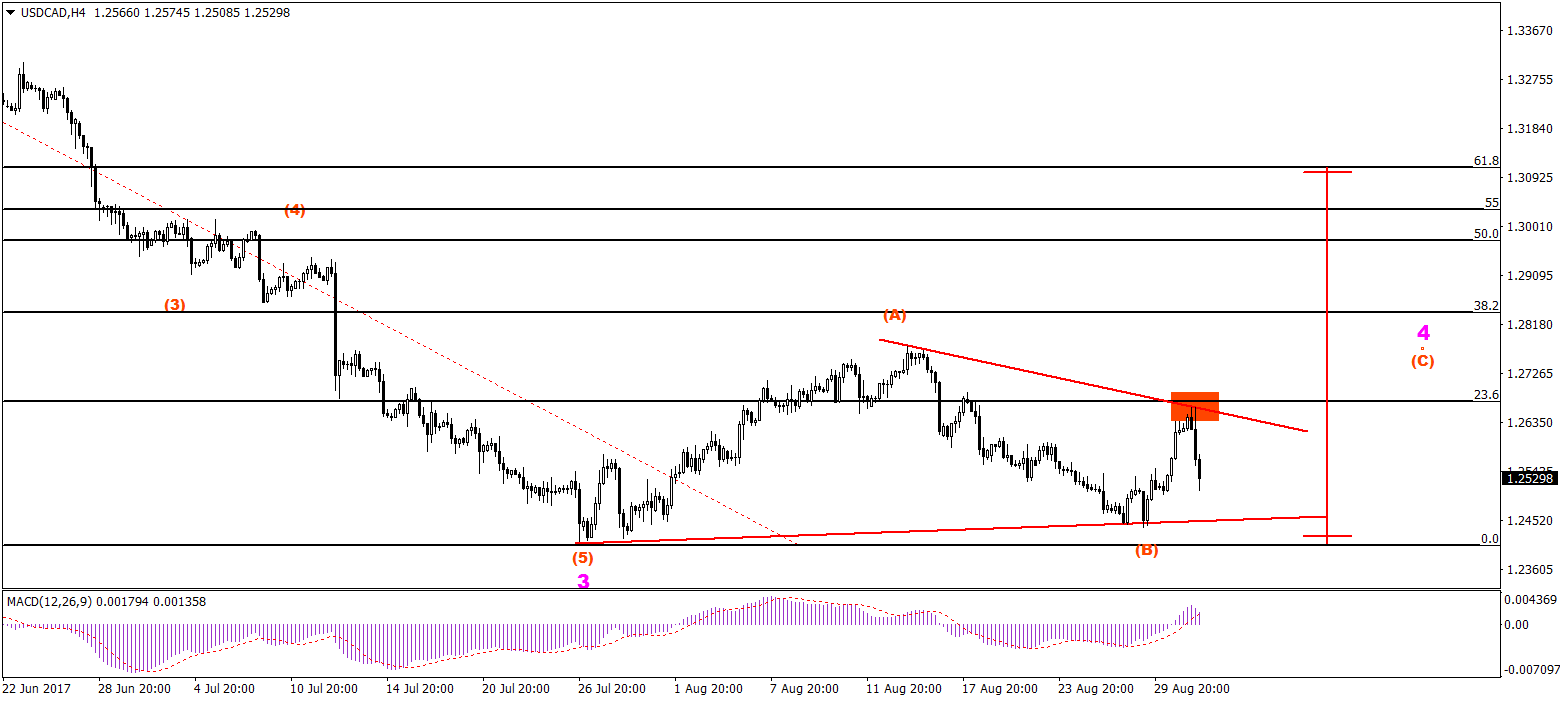
Image 4Hr Chart USD/CAD
How Far can Wave 4 Travel?
Let’s draw the Fibonacci retracement tool from wave 2 (pink) to wave 3 (pink). Here we can see that was A (red) has stopped above the 23.6% Fib level. The wave 4 can retrace anywhere between the 23.6% to 50% Fib level, and sometimes even up to the 61.8% Fib.
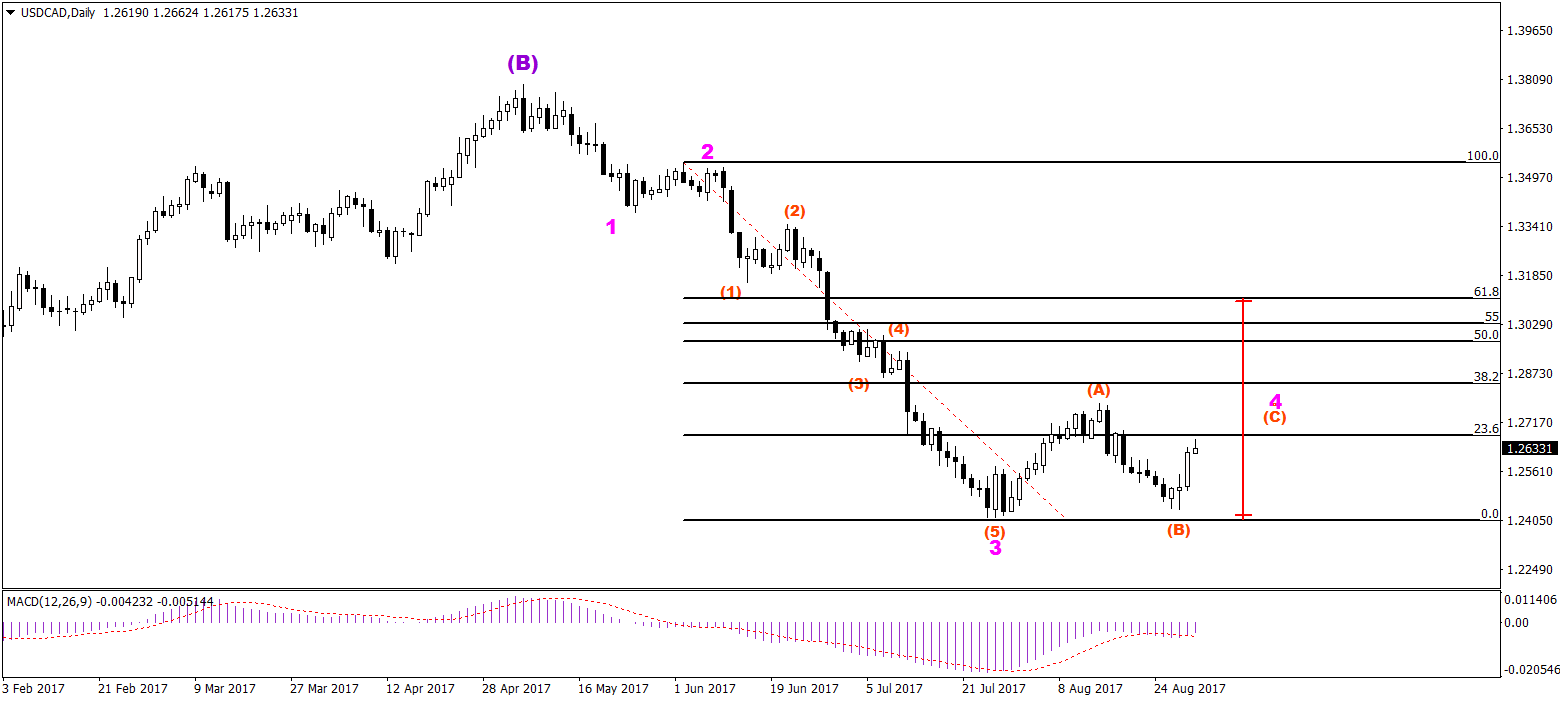
Image Daily Chart USD/CAD
Conclusion: Watch the S&R for Breakouts
The ABC (red) continuation within wave 4 (pink) depends on the break above 1.2667 and 1.2784.
- If there is a bullish break, then price could continue with its zig zag and head towards the 38.2% Fib.
- If the price breaks below 1.2400 first, then wave 4 (pink) is probably complete and wave 5 (pink) could start.
Many green pips,
Elite CurrenSea team
More info on our ecs.SWAT course and trading system
Twitter: @EliteCurrenSea
YouTube: Elite CurrenSea


Leave a Reply