? USD/JPY Prepares for Bearish Breakout of Triangle Pattern ?
Subscribe
Hi traders,
The USD/JPY made a strong bullish bounce but a new bearish breakout could see price fall towards the Fibonacci targets to complete the wave E (purple) of the triangle chart pattern on the daily chart.
USD/JPY
4 hour
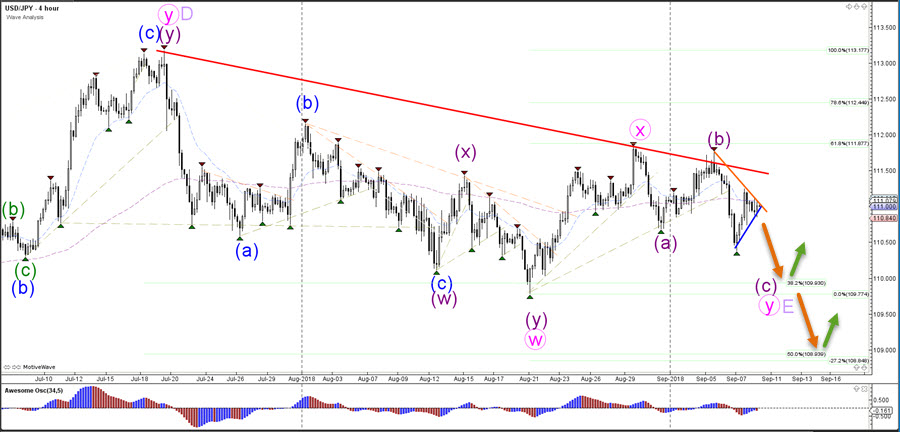
The USD/JPY is still probably building an ABC (purple) zigzag pattern within wave Y (pink). The confirmation of this wave pattern occurs when price is able to break below the support trend line (blue). A break above the resistance trend lines (orange/red) indicates a change of wave patterns.
1 hour
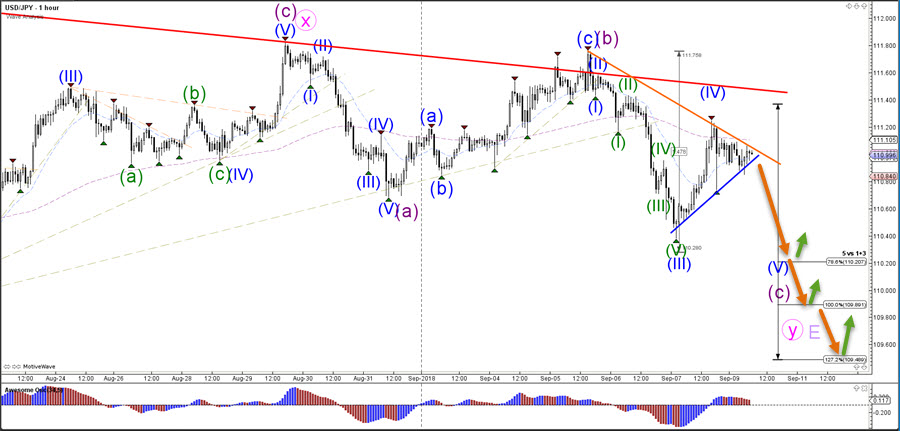
The USD/JPY is probably in a wave 4 (blue) retracement, unless price breaks above the resistance trend line (orange). A break below support (blue) could indicate a bearish breakout towards the Fib targets. The S&R lines of the triangle pattern seem to be critical for the next direction.
Good trading,
Chris Svorcik
Elite CurrenSea


Leave a Reply