? USD/JPY Confirms Uptrend with Higher High and Triangle ?
Subscribe
Hi traders,
the USD/JPY bullish price action and break above the resistance trend line (dotted red) could finally indicate a trend change from bearish to bullish.
USD/JPY
4 hour
The USD/JPY seems to have completed a wave E triangle (purple) of a wave B (red) correction at the recent low. The current uptrend could indicate the start of a larger wave C (red) if price manages to show more bullish impulsiveness that can break above 107.50.

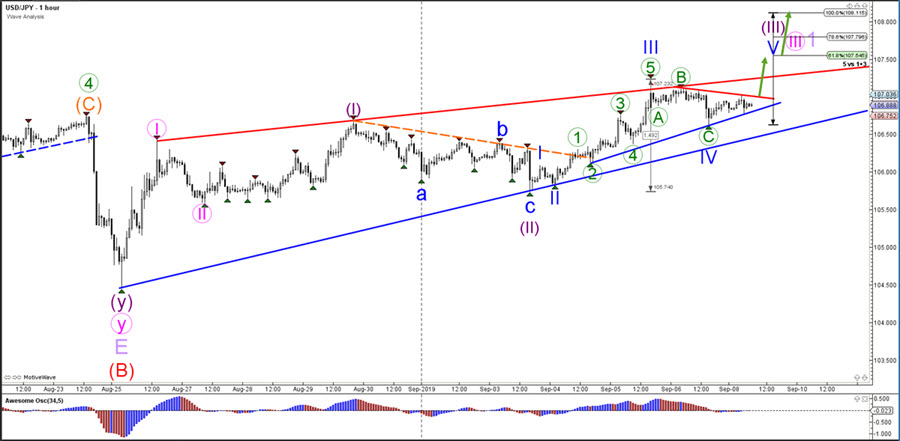
1 hour
The USD/JPY is potentially building multiple waves 1-2 if price is able to break above the resistance trend lines (red) and confirm a strong wave 3 (purple/pink). The Fibonacci levels are potential targets of the bullish breakout.
For more daily wave analysis and updates, sign-up up to our ecs.LIVE channel.
Good trading,
Chris Svorcik Elite CurrenSea


Leave a Reply