USD/CAD – Bounce or Break Point
January 30, 2018
2 min read
Subscribe
Dear Traders,
The USD/CAD finds itself at a critical junction, which will decide its course for the coming months.
This analysis will take a look at this important decision zone, and discuss what price action scenarios could unfold.
Retracement or Trend Continuation?
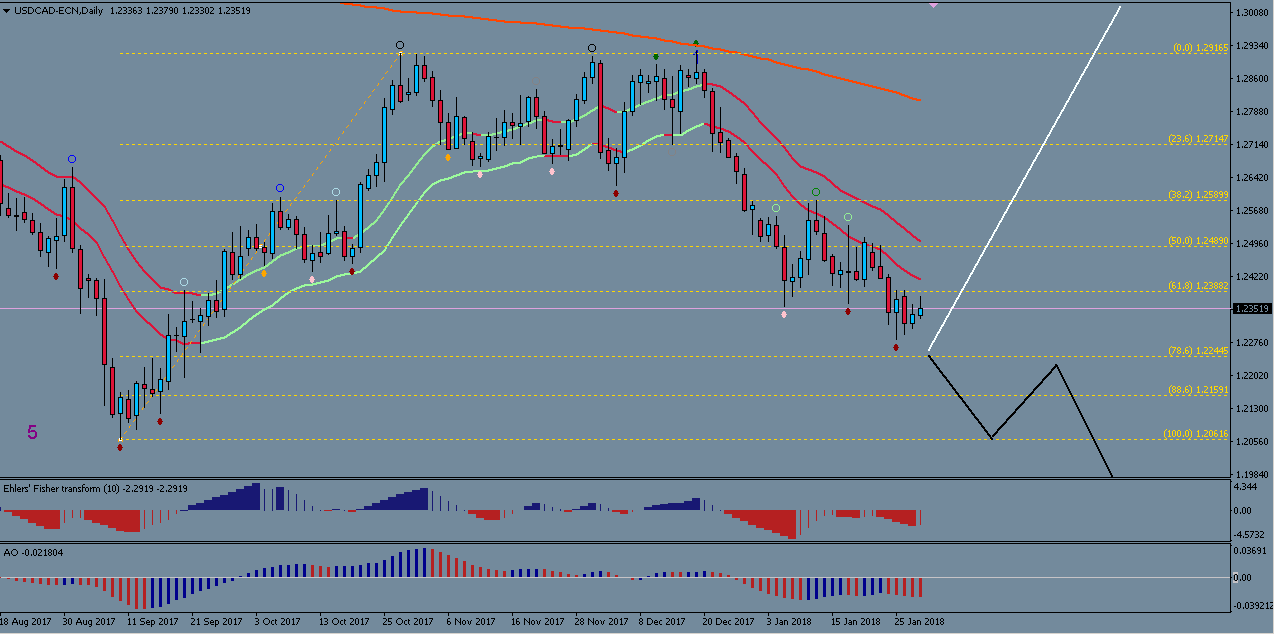
The USD/CAD stopped its strong bearish trend back in September 2017, when it created the last major low. Price made a bullish bounce at the 50% Fib level of a longer-term uptrend at that time. Since December price has however showed renewed bearish momentum. The pair is now at a key decision zone. Following are two possible scenarios:
Bullish Bounce Scenario:
- The chart above shows how price is testing the deeper fib levels of the bullish swing of Sep – Dec 2017. If a new uptrend has started in Sep 2017, price must show a strong bullish bounce at one of those fibs very soon. If this happens, the way is open for a long bullish rally that should see price eventually break above the 2016 high of 1.47
Bearish Break Scenario:
- If price breaks below the September low, the way is opened up for a bearish trend continuation. The price action between Sep – Dec 2017 would then have only been a temporary correction in the overall downtrend.
- The wave structure of the upwards move of Sep-Dec 2017 looks more like a 3-wave structure, which could indicate that the bearish break scenario is more likely.
All the best along your trading journey
Hubert

.





Leave a Reply