GBP/AUD – Reversal Starting to Take Shape
Subscribe
Dear Traders,
The GBP/AUD has shown strong bearish pressure since my previous analysis.
Today’s post wil provide an update on the most recent price-action and Elliott wave progression.
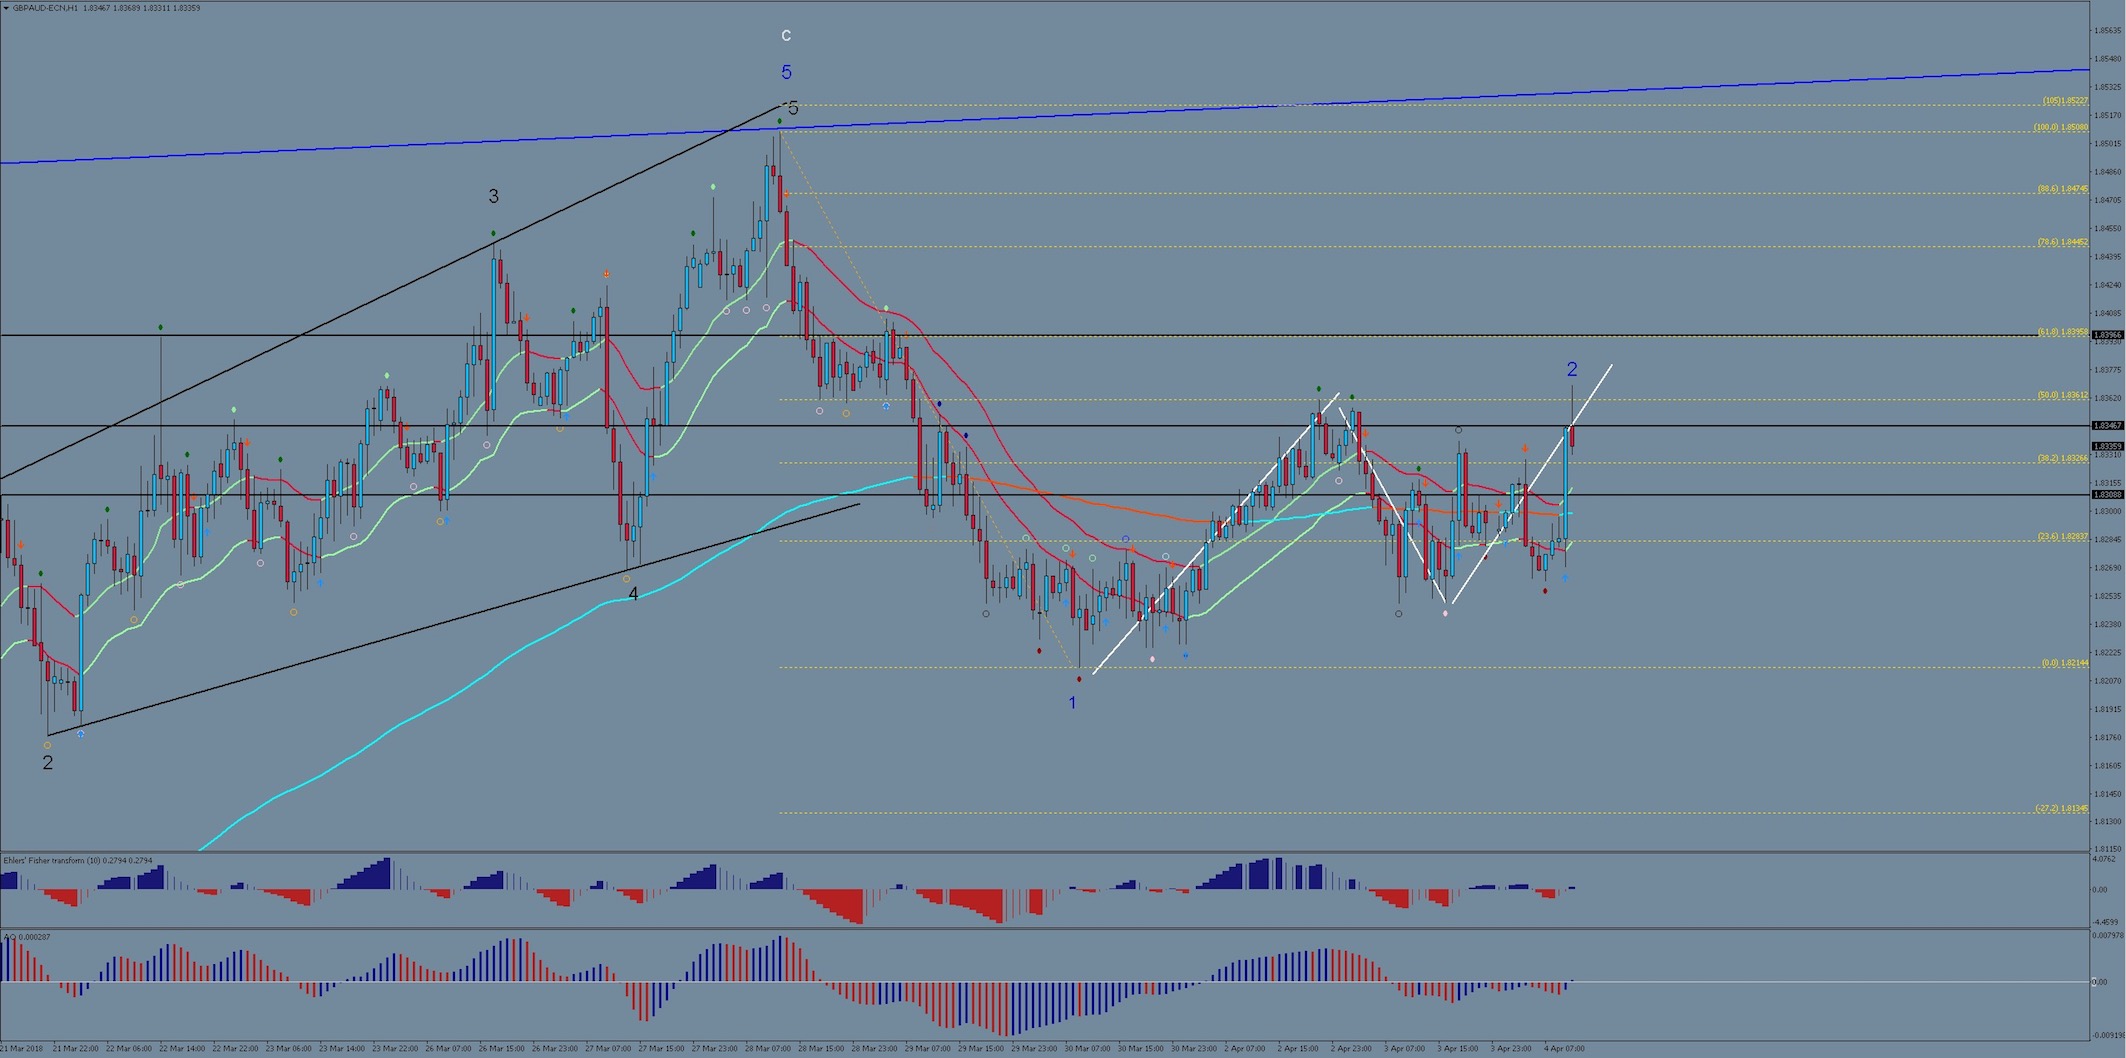
The chart above shows the GBP/AUD price movements since the last high at 1.85, which probably concluded an expanding diagonal. The first bearish swing appears to be a full 5-wave impulse. Price action since the low of Mar 30 looks more corrective in nature (zigzag?). Price has now retraced to the 50% fib of the first bearish swing. There is also further resistance slightly higher at the 61.8% level which coincides with another horizontal resistance level. All of this fits well into a potential wave 1-2 scenario so far.
If this is indeed a new bearish trend in the making, we need to see renewed selling pressure fairly quickly. Ultimate invalidation lies at the high of 1.85, but we should see a bearish u-turn sooner than that if this analysis is correct. Another strong bearish 4 hour candle that bounces at the 50 or 61.8 fib and closes below the 21 EMA band would be a good early confirmation signal for new short entries.
Interim targets could be 1.8130 (roughly the zone of the 4hour chart 144 EMA), and beyond, 1.76 was a strong previous support much lower down. In the longer-term, however, there is scope for this pair to fall as low as 1.58, the low of Nov 2016.
All the best along your trading journey
Hubert
.


Leave a Reply