? GBP/USD Long-Term Wave Analysis 29 Oct ’18 ?
Subscribe
Hi traders,
The GBP/USD is either building a bearish 123 (purple) or ABC (red) pattern. A bearish 123 would indicate a full downtrend but would require price to eventually break below the 161.8% Fibonacci target.
GBP/USD
Daily
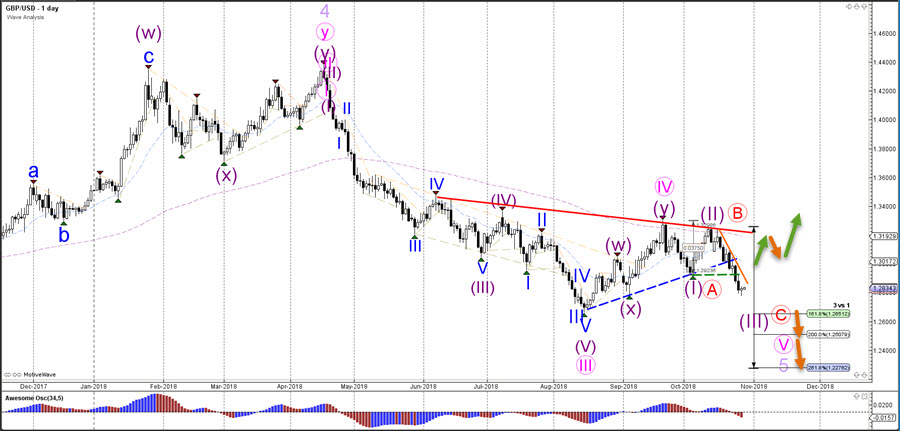
The GBP/USD bullish bounce before reaching the 161.8% Fibonacci target could indicate an ABC zigzag (red) pattern. Price would need to break above the resistance trend line (orange) as well. A bearish ABC could indicate that the next swing is a bullish ABC.
Weekly
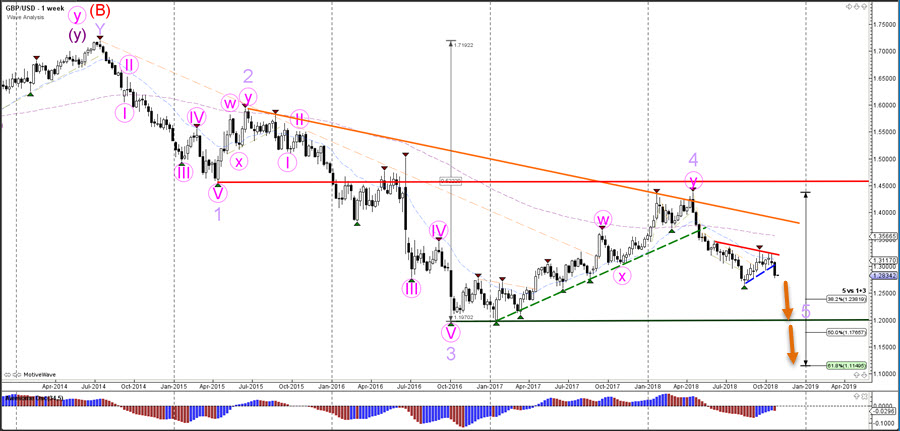
The GBP/USD is in a long-term downtrend and broke below the support level of the recent triangle pattern.
Monthly

The GBP/USD seems to be in a wave 5 (purple) of a larger bearish trend and 5 wave pattern.
For more daily wave analysis and updates, sign-up up to our ecs.LIVE channel.
Good trading,
Chris Svorcik
Elite CurrenSea


Leave a Reply