? GBP/USD Falling Wedge Pattern Indicates End of Downtrend? ?
Subscribe
Hi traders,
The GBP/USD reversed at the support trend line (green) with strong bullish momentum. Due to the impulsive price action and falling wedge chart pattern (red-green lines), this chart is indicating the potential for a larger wave 2 (pink) correction.
GBP/USD
4 hour
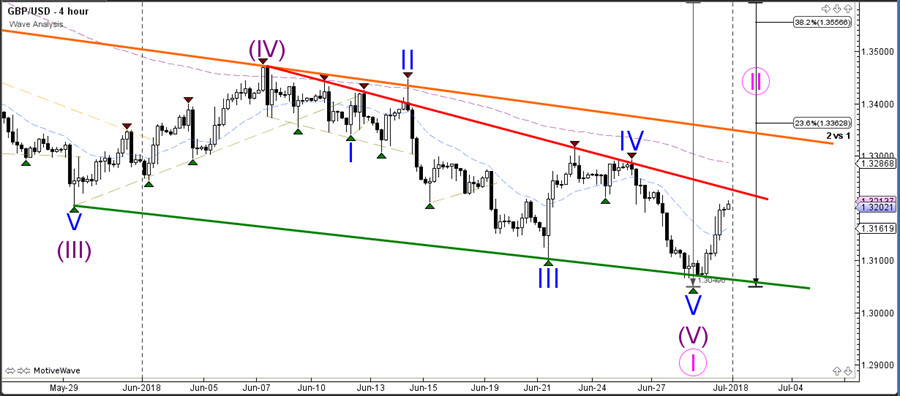
The GBP/USD however remains in a downtrend and the bullish price action could just be a retracement. For a bearish continuation to be more likely, price would need to show bearish momentum followed by a break of a bear flag chart pattern.
1 hour
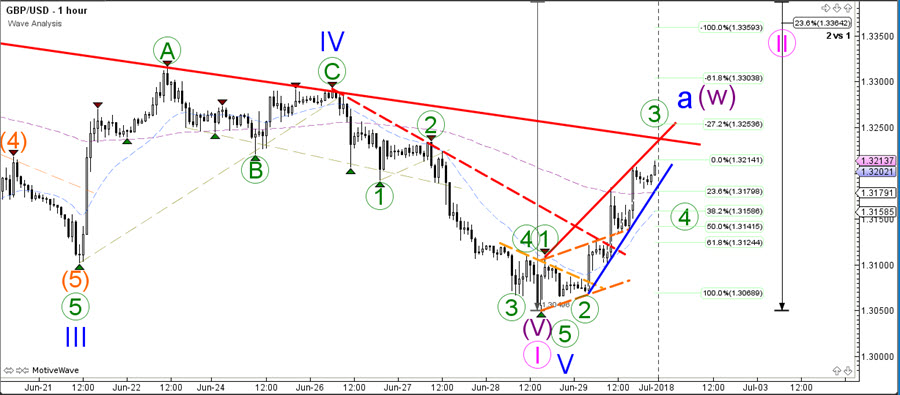
If the GBP/USD is building a larger bullish correction, then it could be doing that via an ABC zigzag. The current bullish impulse could be a wave 3 (green) if price respects the Fibonacci levels of wave 4 (green). Waves 4 usually respect shallow Fibs like the 23.6, 38.2, 50% Fibs but a break below the 61.8% Fib invalidates this wave pattern.
Good trading,
Chris Svorcik
Elite CurrenSea


Leave a Reply