✅ GBP/USD Breaks Resistance but Faces Wave 4 Fib Levels ?
June 4, 2018
2 min read
Subscribe
Hi traders,
The GBP/USD is building a higher high but the overall pattern remains bearish. The bullish correction could easily be a wave 4 (purple) correction after a strong bearish wave 3.
GBP/USD
4 hour
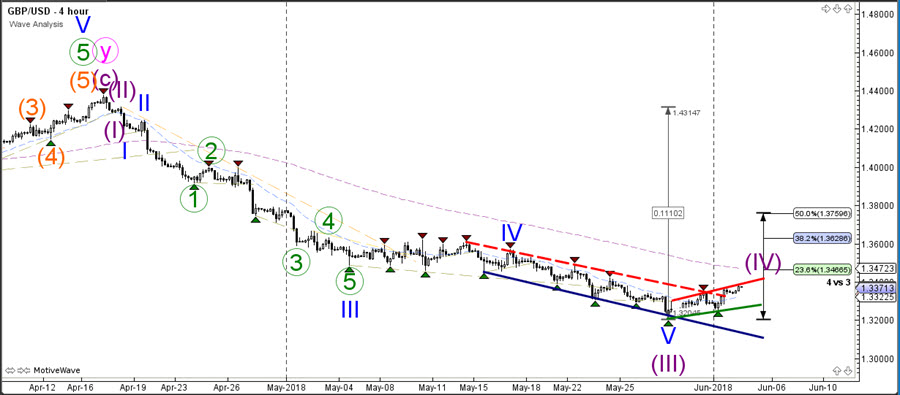
The Fibonacci levels of wave 4 vs 3 could act as resistance spots if the wave 4 pattern plays out as expected. A break above the 38.2-50% Fib zone indicates that the wave 4 is not likely anymore and price could be making a larger bullish pullback within wave 2.
1 hour
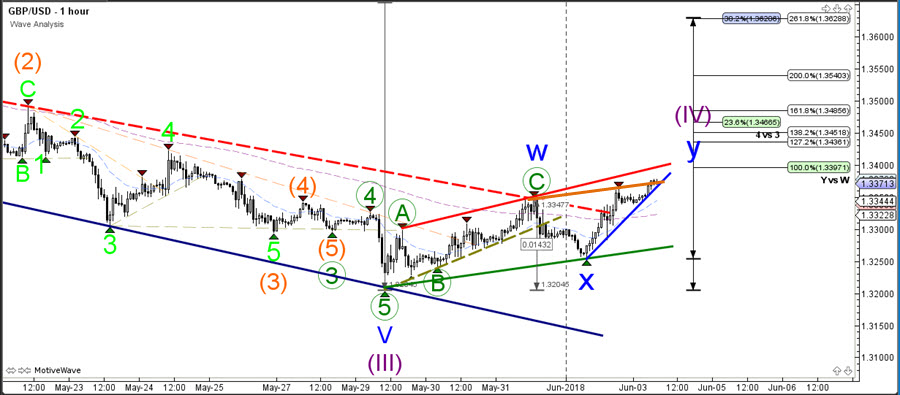
The GBP/USD broke above a key resistance trend line (dotted red) after failing to break below the support at 1.3250. Price could be building another ABC pattern within wave Y (blue) which could take price up to the Fibonacci levels and targets.
Good trading,
Chris Svorcik
Elite CurrenSea
.


Leave a Reply