🚀 Gold Uptrend Offers Similar Wave-4 Pullbacks on Two Time-Frames 🚀

Dear traders,
Gold (XAU/USD) made a strong bullish bounce at the 38.2% Fibonacci retracement level. This is probably a wave 4 pullback, which means that more uptrend is still expected.
This article reviews the Elliott Wave patterns and Fibonacci levels on the XAU/USD weekly and 4 hour charts.
Price Charts and Technical Analysis
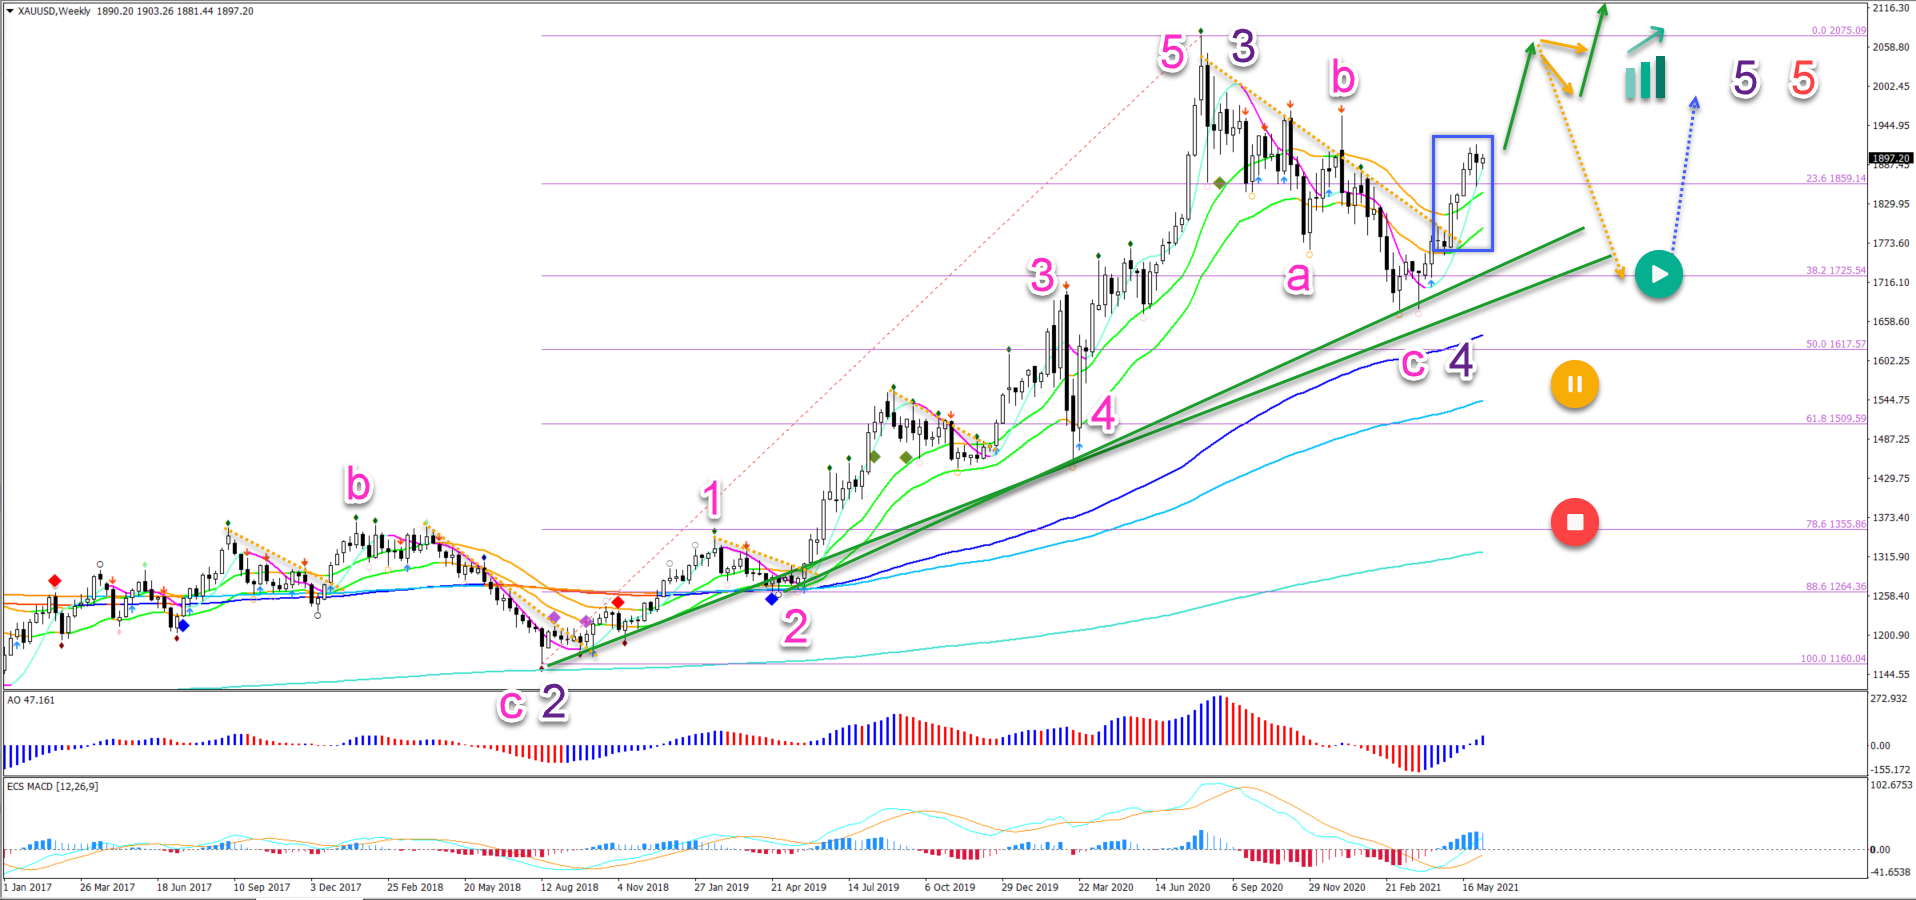
The XAU/USD seems to have completed a strong bullish impulse, which has been labelled a wave 3 (purple). An ABC pattern (pink) took price back to the 38.2% Fibonacci level, which acted as a support zone. Price action broke above the 21 ema zone and resistance trend line (dotted orange) as well. Let’s analyse what to expect next:
- The bullish impulse and breakout (blue box) above the 21 ema zone is strong. A retest of the previous top is likely (first green arrow).
- A sideways bull flag pattern (orange arrows) could indicate that the uptrend is dominant (second green arrow).
- A strong bearish bounce (dotted orange arrow) indicates that the wave 4 (purple) pullback will expand into a larger and more complex ABC pattern.
- The previous bottom should still act as support (dotted blue arrow).
- The main targets are the -27.2% and -61.8% Fibonacci levels at $2319 and 2634. Round levels like $2250 and $ 2500 are also targets.
- A break below the 50% Fib places this Elliott Wave outlook on hold (orange circle) and a deep retracement invalidates it (red circle).
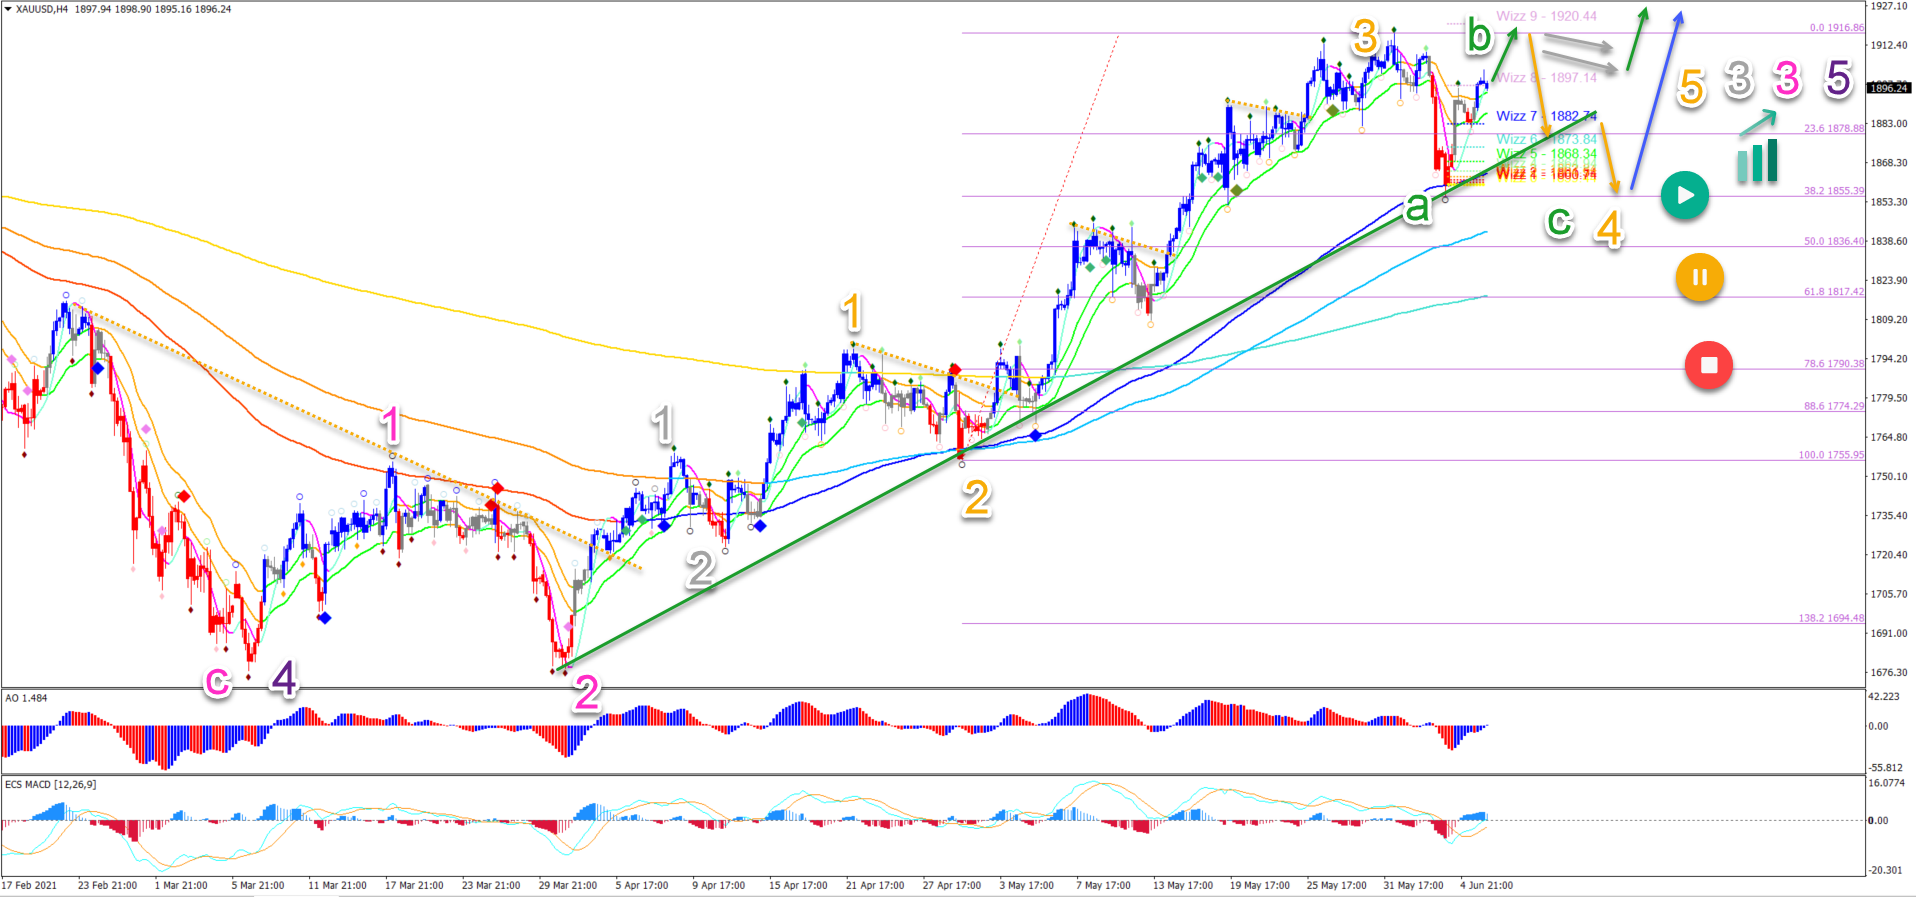
On the 4 hour chart, price action seems to be developing a strong bullish impulse. This is probably a wave 3 (grey) of a wave 3 (pink):
- The pullback respected the 38.2% Fibonacci as well, which is probably a wave 4 (orange).
- A bearish ABC (green) pattern is expected to develop within wave 4 (orange).
- A bullish bounce is expected at support (blue arrows).
- A bull flag pattern (grey arrows) could indicate an immediate uptrend (green arrow).
- A break below the 50% Fib places this Elliott Wave outlook on hold (orange circle) and a deep retracement invalidates it (red circle).
- The main targets are the Fibonacci targets at $1960, $2016, $2078, $ 2179, and $2234 for the wave 3 (grey).
The analysis has been done with the indicators and template from the SWAT method (simple wave analysis and trading). For more daily technical and wave analysis and updates, sign-up to our newsletter.
Good trading,
Chris Svorcik


Leave a Reply