🚀 EUR/USD Bulls Taking Control at 1.1750 after Bearish ABC 🚀


Dear traders,
the EUR/USD bullish reversed strongly at the 1.16 support zone. Will the EUR/USD push up higher? And will it continue with the uptrend?
Both questions are answered in detail in this article. But we also explore the expected Elliott Wave patterns and chart patterns.
Price Charts and Technical Analysis
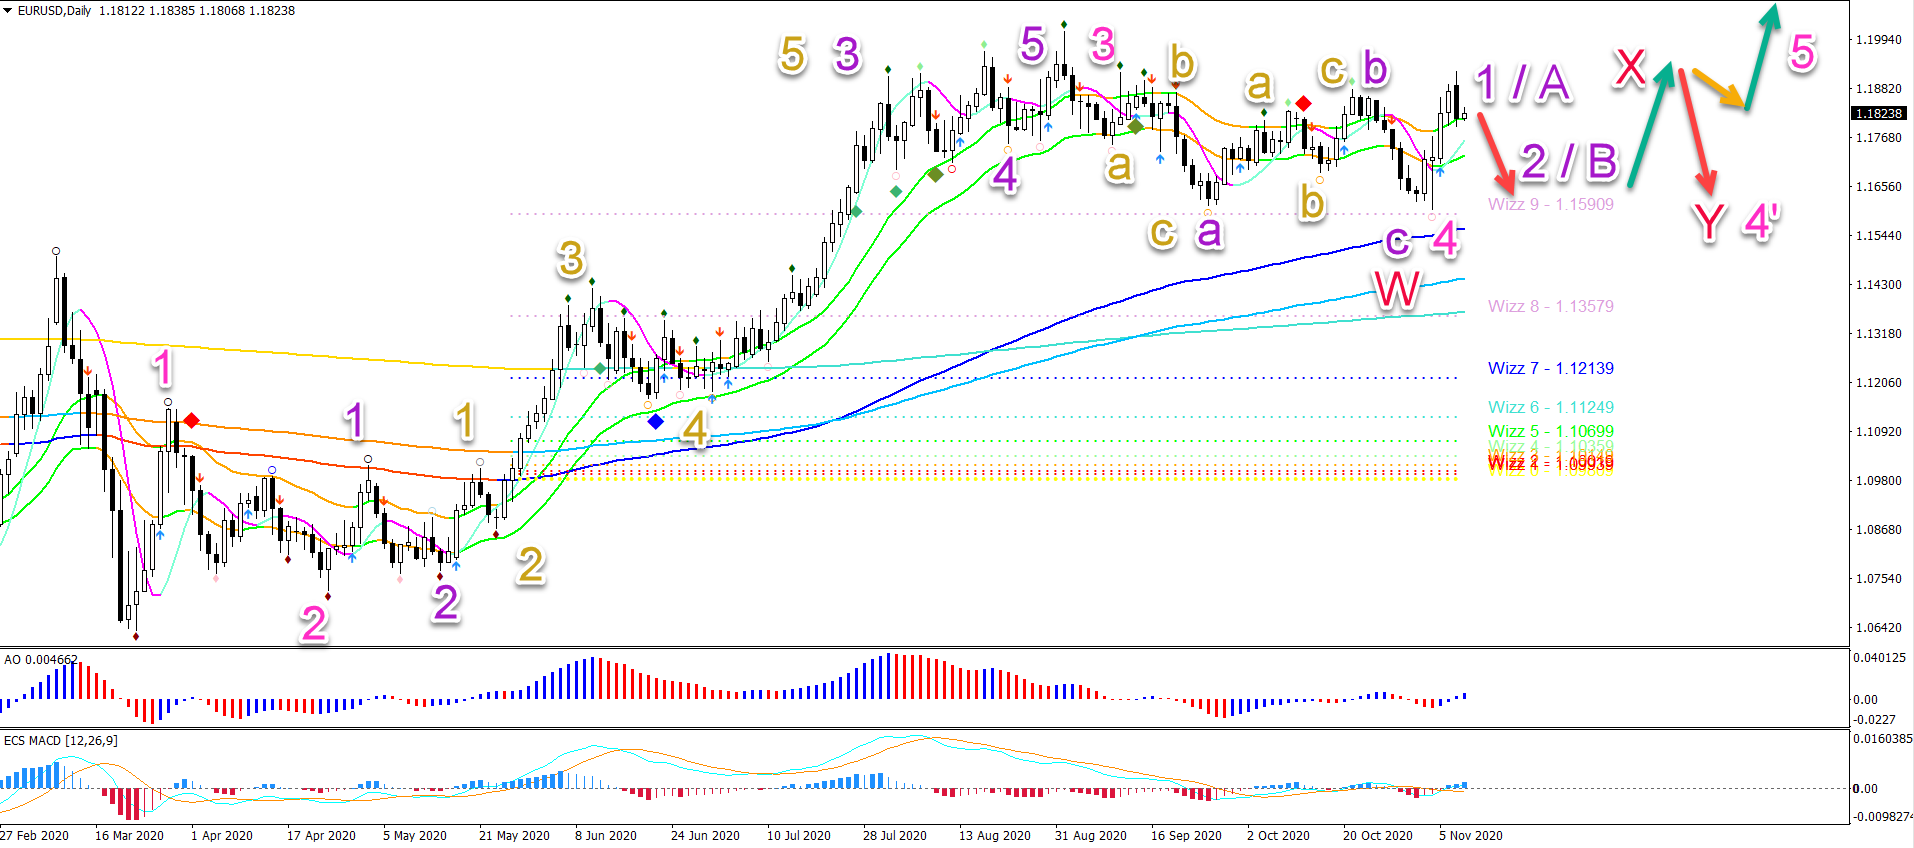
The EUR/USD bullish breakout above the 21 ema zone will probably see a bearish retracement first. But price action is expected to continue higher after the pullack.
This is true for both the wave 1-2 scenario and the wave A-B outlook. Both Elliott Wave scenarios indicate a bearish price swing followed by a bullish price swing.
The main difference between the two scenarios is the expected price reaction at the resistance.
- A strong decline at the previous top indicates an ABC pattern in wave X (red) and one more leg lower to complete wave Y (red) of wave 4’ (pink).
- A bullish flag indicates continuation for a full uptrend within wave 5 (pink).
On the 1 hour chart, price action completed a bullish 5 wave pattern (yellow) within the wave 1 or A (purple). The bearish breakout below the support trend line and 21 ema confirms the end of the wave 1.
The bearish momentum is probably part of a wave A (orange) of a larger bearish ABC pattern. This becomes invalid if price action breaks below the bottom (red circle).
A bearish breakout is expected to reach and test the support from the Fibonacci retracement levels and Fib targets. This would complete wave C (orange) of wave 2 or B (purple).

The analysis has been done with the indicators and template from the SWAT method (simple wave analysis and trading). For more daily technical and wave analysis and updates, sign-up to our newsletter.
Good trading,
Chris Svorcik


Leave a Reply