🎯 EUR/USD Bulls Fighting to Reach 1.1925 Target Zone 🎯

Dear traders,
the EUR/USD made a strong bullish bounce at the 61.8% Fibonacci support zone. This could indicate a larger bullish ABC pattern (purple).
This article will indicate the key zone for the confirmation of the breakout. We also review the targets and invalidation spots.
Price Charts and Technical Analysis
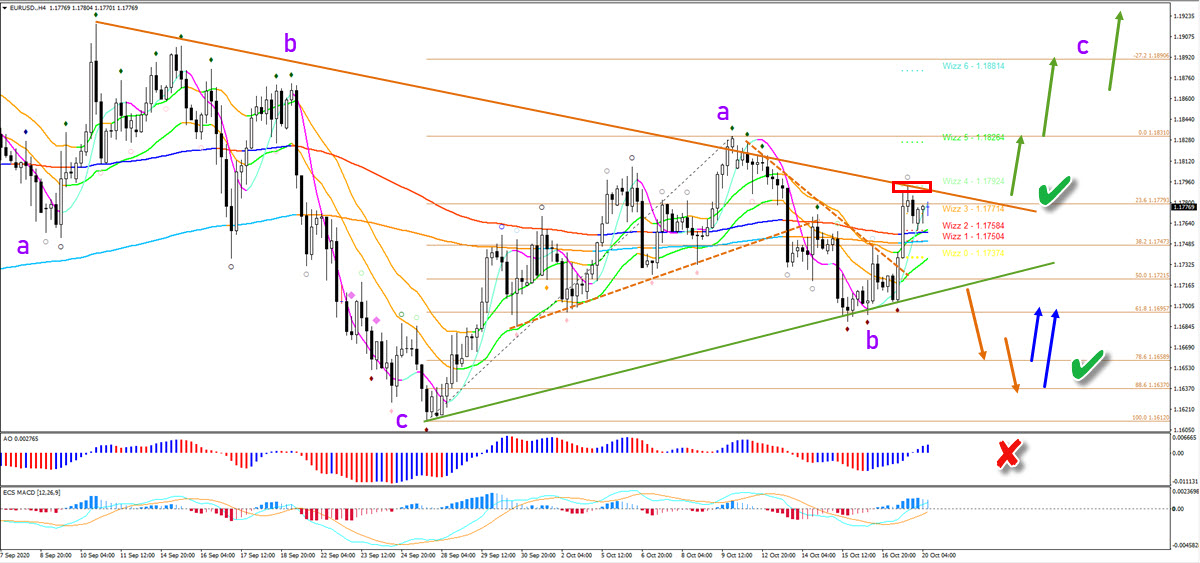
The EUR/USD is testing a key resistance trend line (orange). A bullish breakout above the resistance trend line (orange) and Fractal (red box) confirms the uptrend continuation (green arrows).
In this case, price action is expected to reach the Wizz and Fibonacci targets. The main target could be as high as 1.1925-50 zone where the larger wave C (purple) could be completed.
A bearish breakout (orange arrows) is expected to be just a pullback within wave B (purple). A bullish reversal (blue arrows) could confirm the current wave pattern. Only a break below the bottom invalidates it (red x).
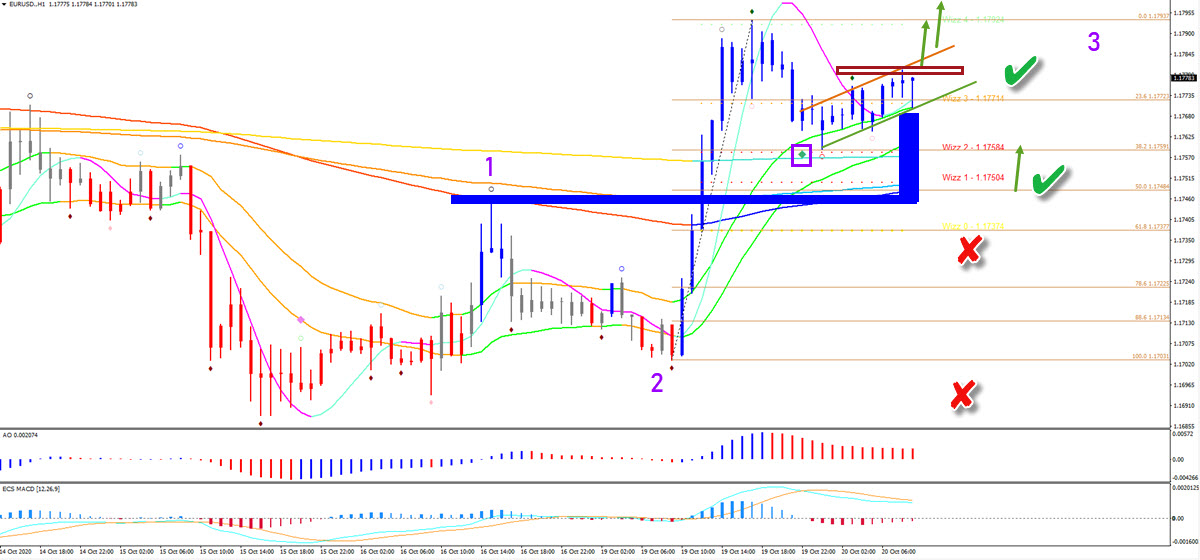
On the 1 hour chart, price action is using the 21 ema zone as a support for a bullish bounce. The 50% Fib also remains a key support zone.
A break below the top of wave 1 invalidates the wave 1-2-3 (purple) pattern but not the entire bullish outlook. Only a break below the bottom would invalidate the entire bullish pattern (red x).
The analysis has been done with the indicators and template from the SWAT method (simple wave analysis and trading). For more daily technical and wave analysis and updates, sign-up to our newsletter.
Good trading,
Chris Svorcik


Leave a Reply