🚀 EUR/USD Bullish Reversal Indicating Start of ABC Zigzag Pattern 🚀

Dear traders,
The EUR/USD made a bullish bounce at the 50-61.8% Fibonacci retracement levels as expected in our EUR/USD and GBP/USD video earlier this week.
However, the impulsive is stronger than expected and the bearish ABC pattern already seems completed at the recent low. This means more upside is likely. Let’s review it.
Price Charts and Technical Analysis

The EUR/USD seems to have completed the wave B (pink) at the 61.8% Fibonacci support zone.
Why? Because the strong bullish bounce is indicating the start of the wave C (pink) zigzag pattern.
The breakout above the resistance trend lines (orange) confirms the continuation of the uptrend (green arrows):
- The ABC (pink) zigzag is now aiming for the -27.2% and/or -61.8% Fibonacci targets around 1.12225-1.23.
- This is where we expect the wave B (purple) of larger ABC (purple) correction to be completed.
- Price should fall once again (red arrows) for a wave C (purple) of wave 4 (red).
- Only a deeper retracement could place the bulls on hold (yellow and red circles).
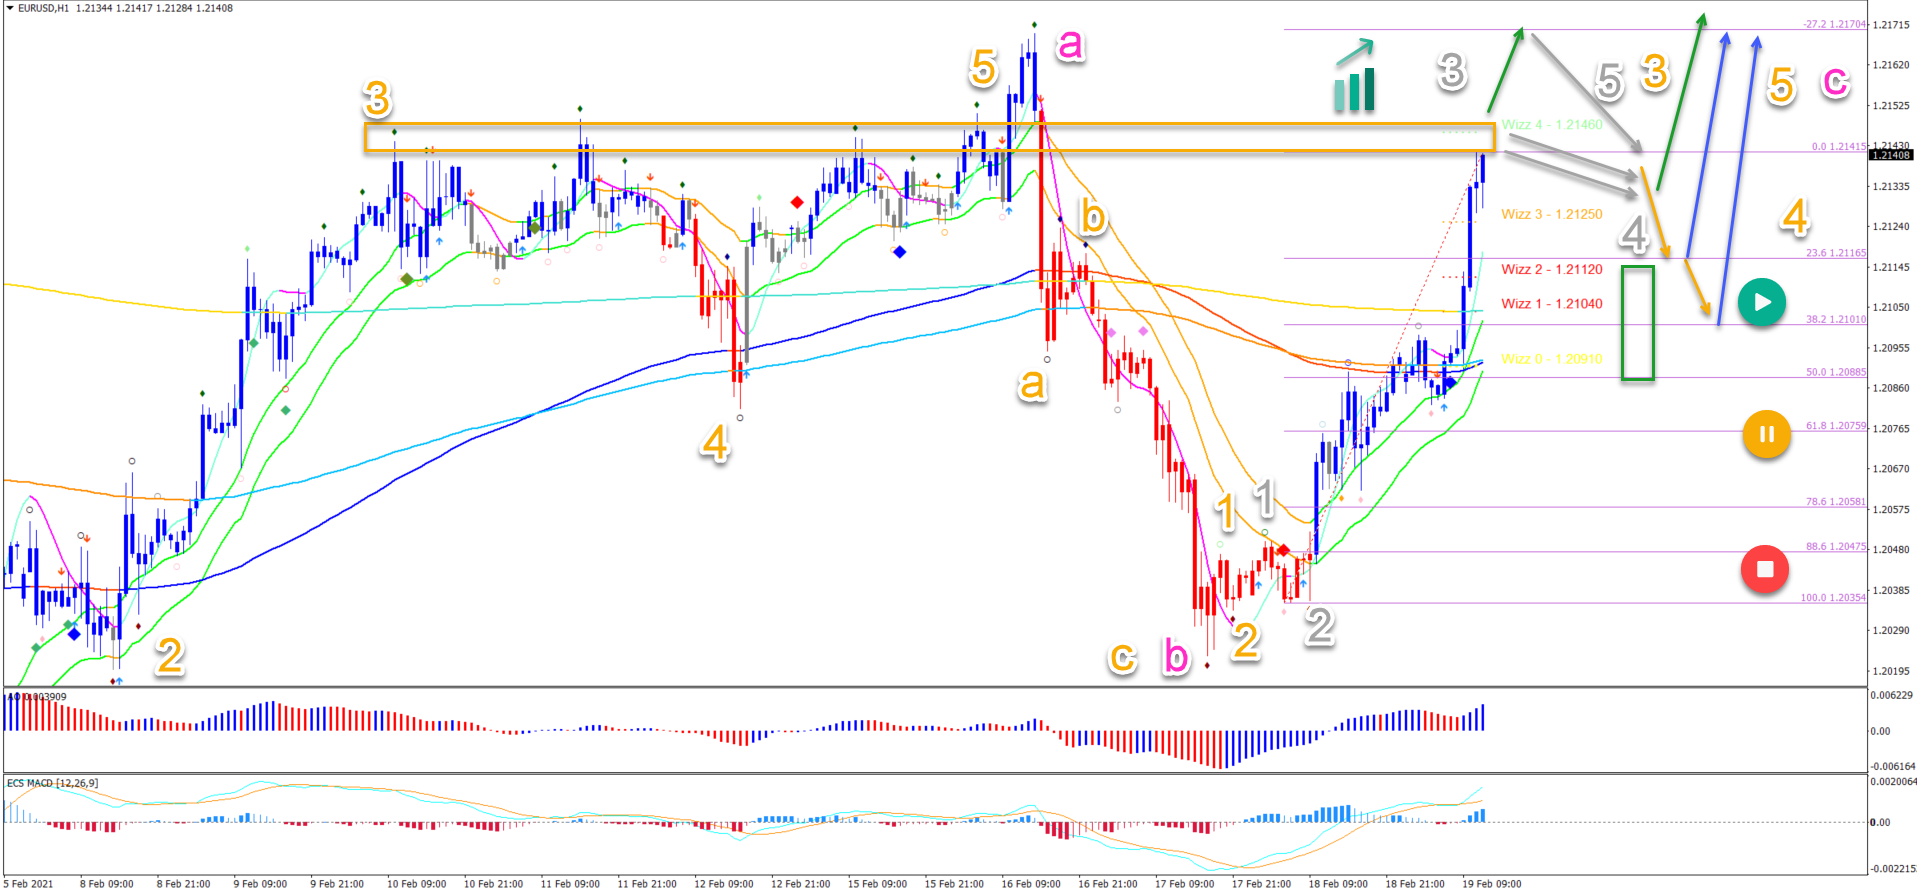
On the 1 hour chart, the current bullish price swing is likely a wave 3 (grey) due to its speed. But price action is now facing a hefty resistance zone from the previous highs (orange box).
- An immediate bullish breakout (green arrow) could take price action higher.
- But a bull flag pattern (grey arrows) is eventually expected in a wave 4 (grey) pullback.
- The breakout confirms the upside (green arrow).
- A shallow retracement (orange arrow) could see it dip towards the 23.6%-38.2%-50% Fibonacci support zone.
- The Fibs are expected to act as a support zone for another rally higher (blue arrows).
- Only a deeper retracement invalidates the bullish outlook (yellow/red circles).
The analysis has been done with the indicators and template from the SWAT method (simple wave analysis and trading). For more daily technical and wave analysis and updates, sign-up to our newsletter.
Good trading,
Chris Svorcik


Leave a Reply