🏁 EUR/USD Break or Bounce Scenarios at 1.20 Resistance Zone 🏁

Dear traders,
the EUR/USD has reached the powerful resistance and target zone at 1.20. Will price action create a larger bearish retracement? Or will the uptrend be able to break above it?
Price Charts and Technical Analysis
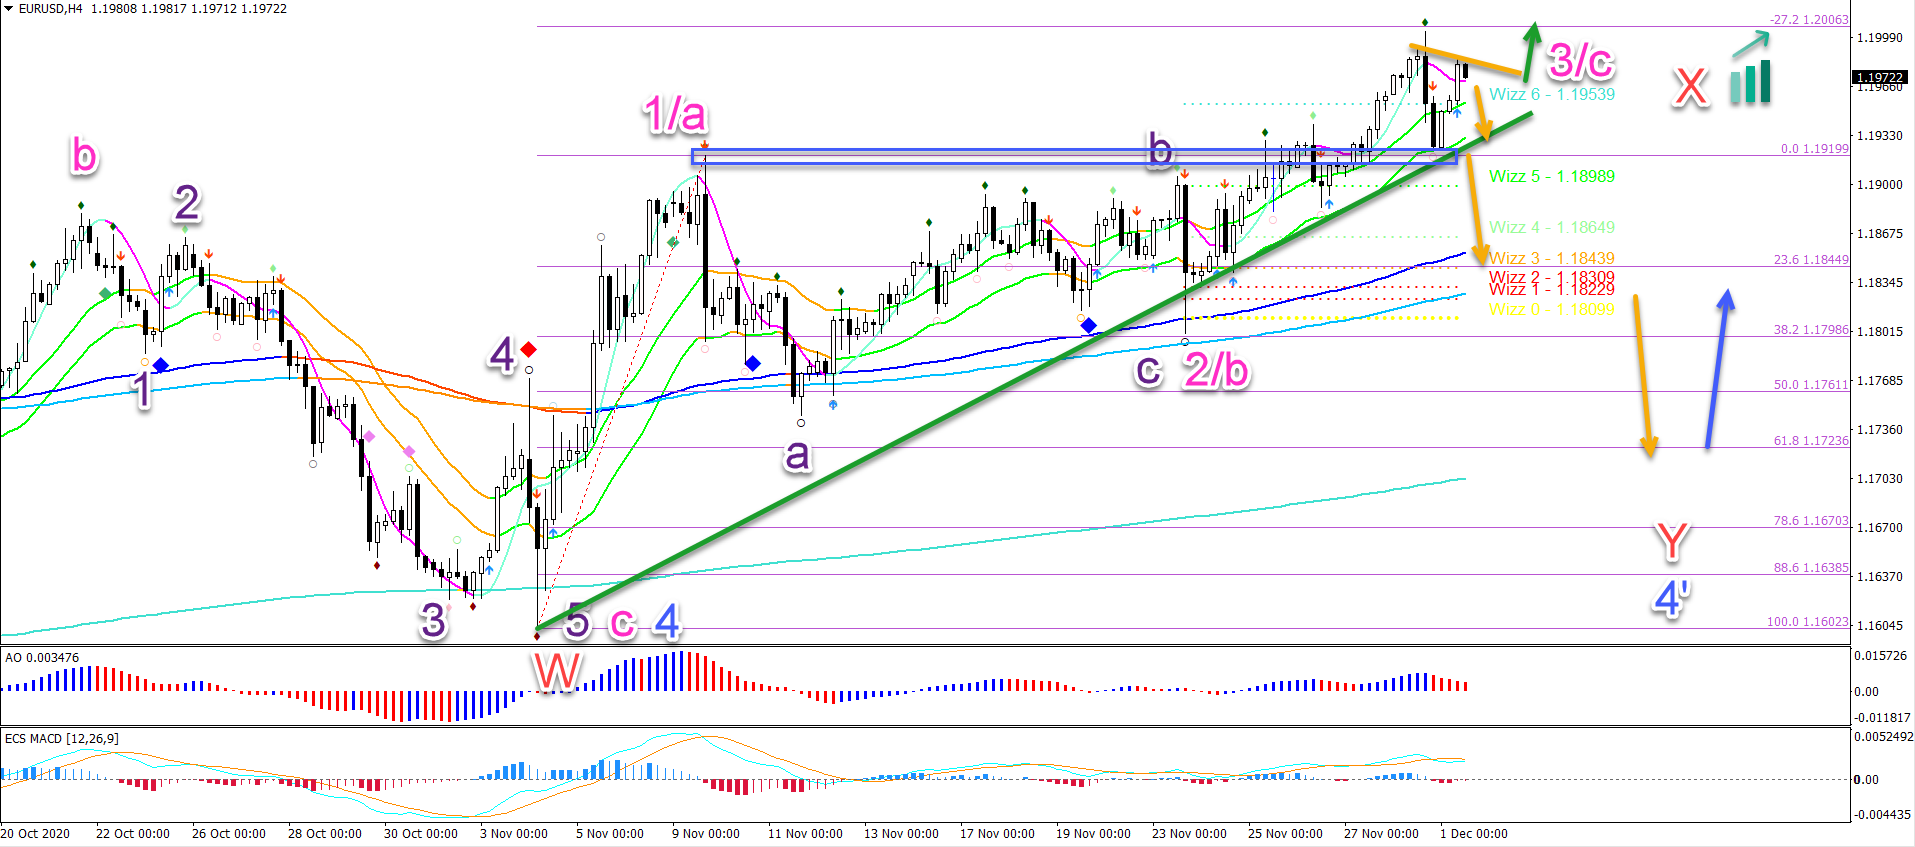
The EUR/USD has reached the -27.2% Fibonacci target at 1.20 (as expected in earlier analysis).The 80 pip bearish reaction reached the previous top (blue box) and 21 ema zone for another move up.
The main question is whether price action has completed a bullish wave C (pink)? Or will it push up higher for a wave 3 (pink)?
The answer depends on the breakout direction:
- A break (green arrow) above the resistance trend line (orange) and 1.20 round level should confirm one more leg in the uptrend.
- A break (orange arrow) below the 21 ema zone and support trend line (green) could send it much lower for a complex correction in wave Y (red) of an expanded wave 4’.
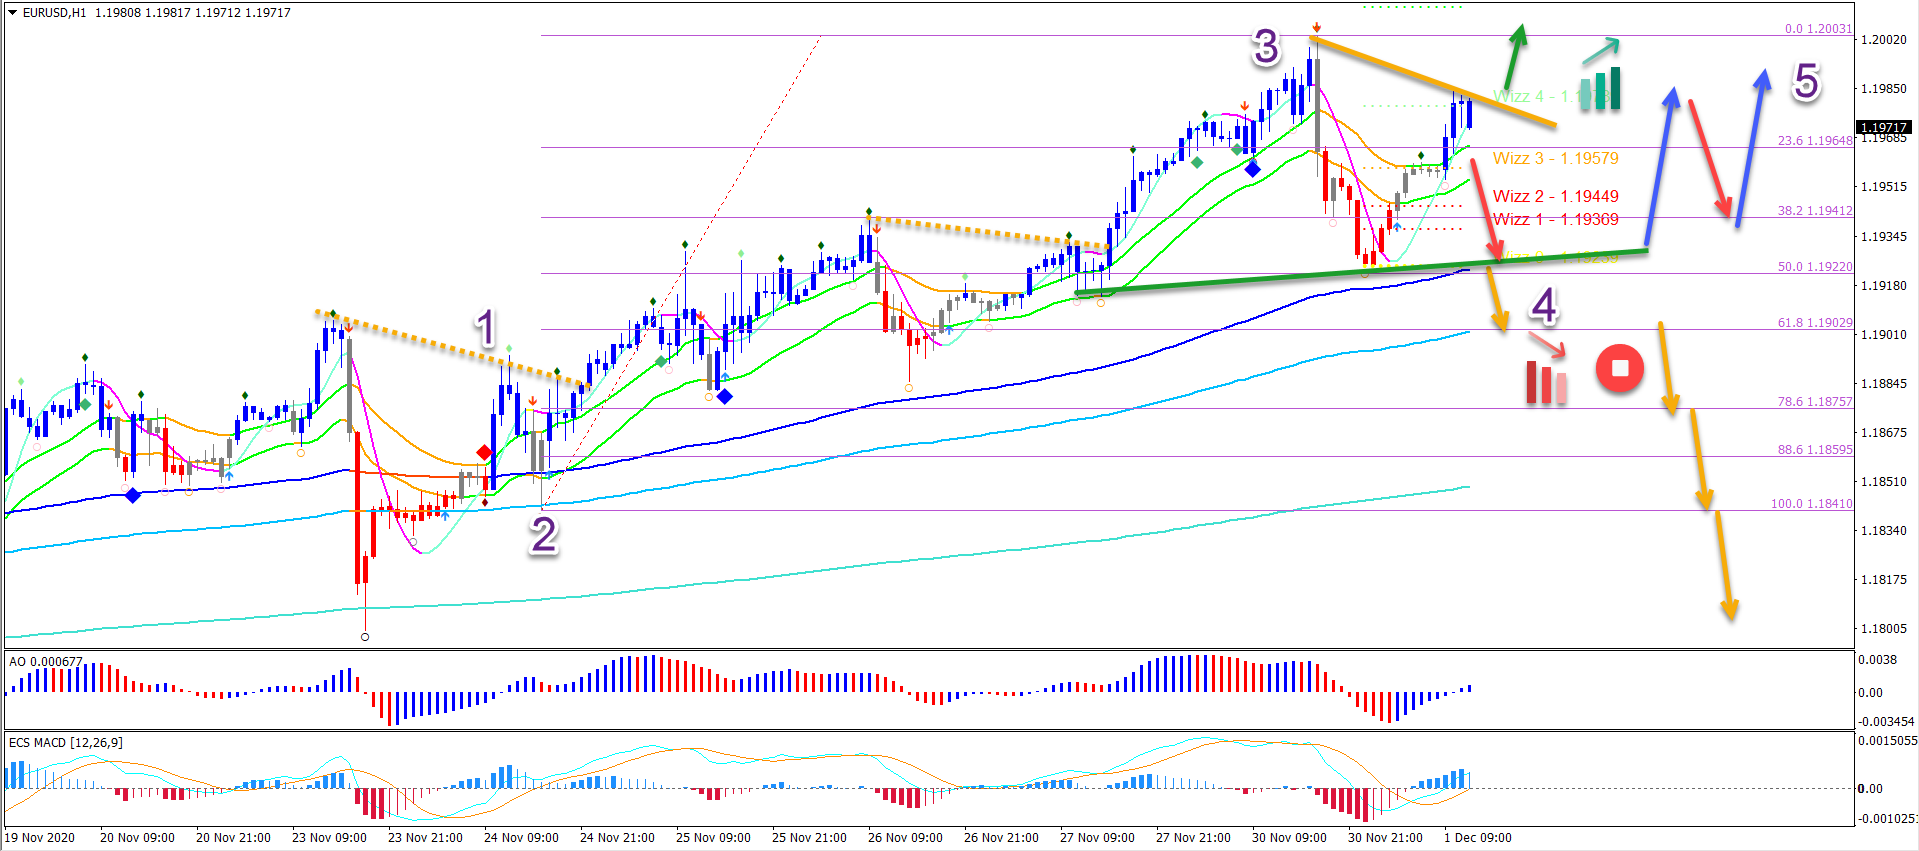
On the 1 hour chart, the current bearish pullback might be a wave 4 (purple). But the price action must be a triangle pattern (red and blue arrows), otherwise the bearish momentum could indicate a reversal.
The reversal is confirmed once price breaks below the 50-61.8% Fibonacci retracement soon. In that case, a downtrend has an edge (orange arrows).
A break above the top or a bullish break after a triangle pattern could confirm the uptrend.
The analysis has been done with the indicators and template from the SWAT method (simple wave analysis and trading). For more daily technical and wave analysis and updates, sign-up to our newsletter.
Good trading,
Chris Svorcik


Leave a Reply